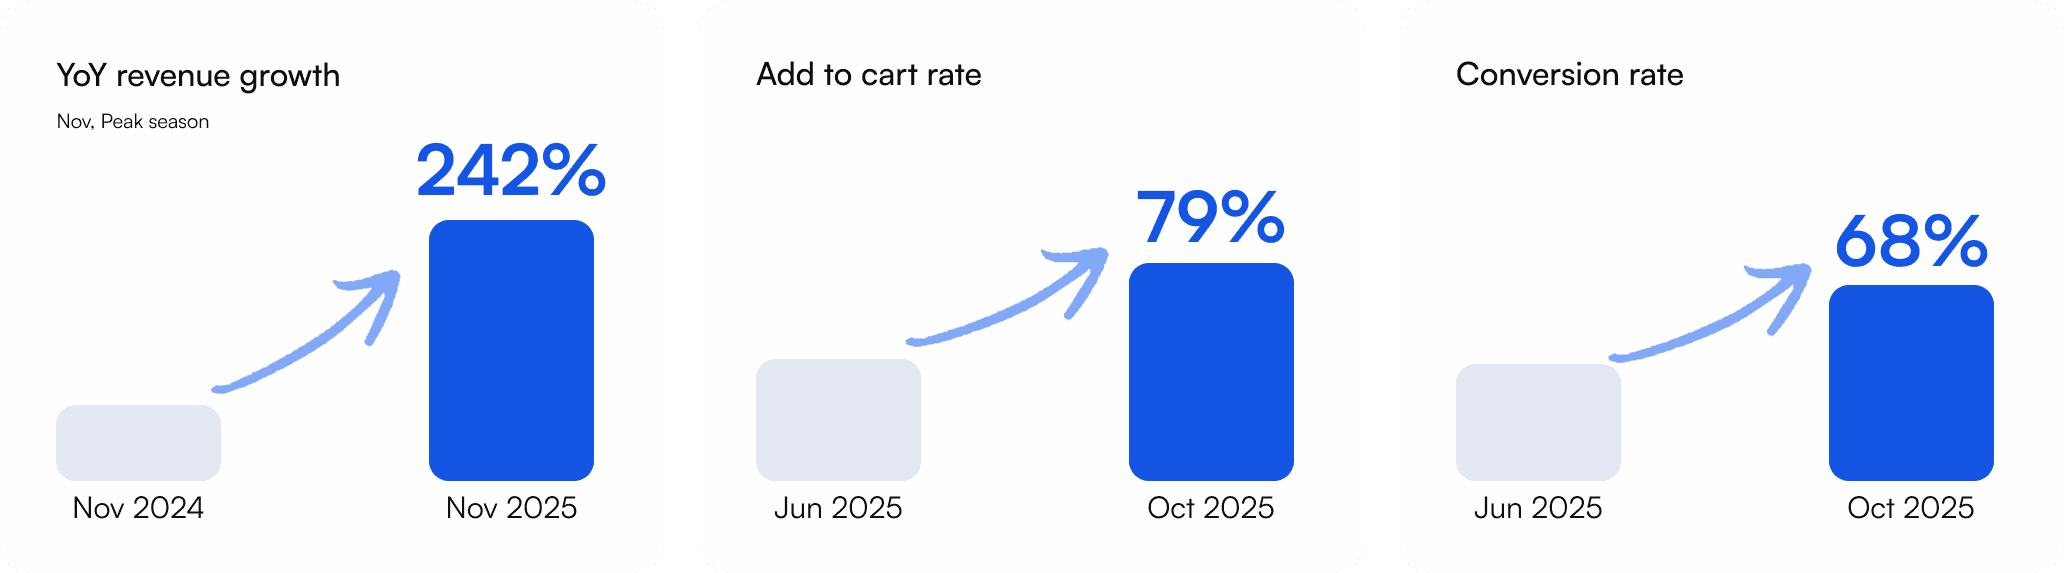
79% lift in add-to-cart, 68% in purchase conversion
Summary
As marketing spend increased, Kara Beauty was doubling its traffic without moving its order count. I led the redesign of the shopping experience, focusing on where users struggled to discover, evaluate, and act on products. By restructuring navigation and surfacing decision-critical information across the homepage, PLP, and PDP, add-to-cart rate rose 79% and purchase conversion 68%.
THE BUSINESS PROBLEM

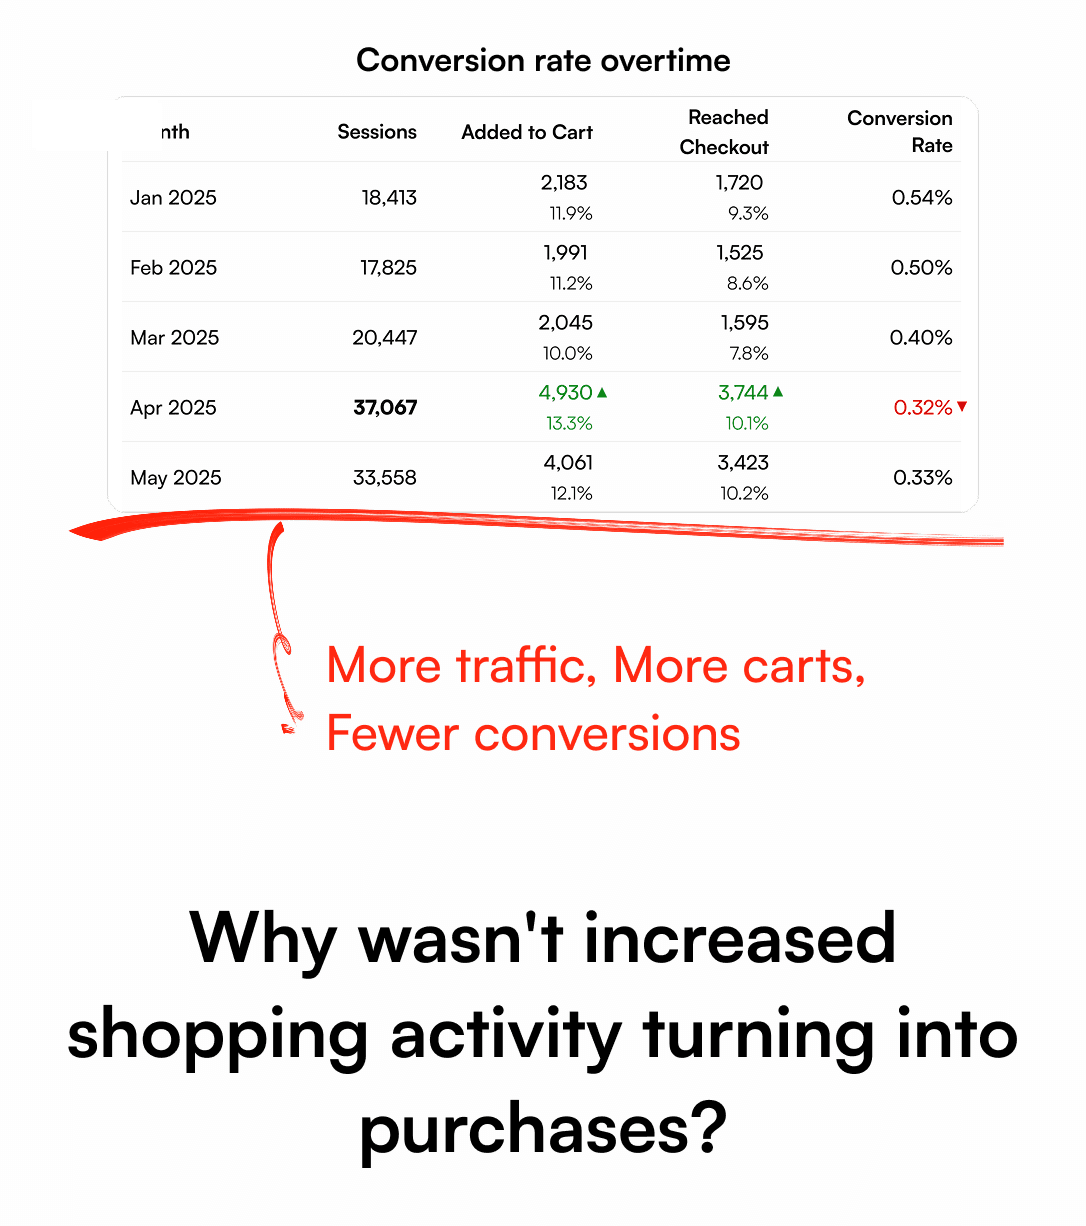
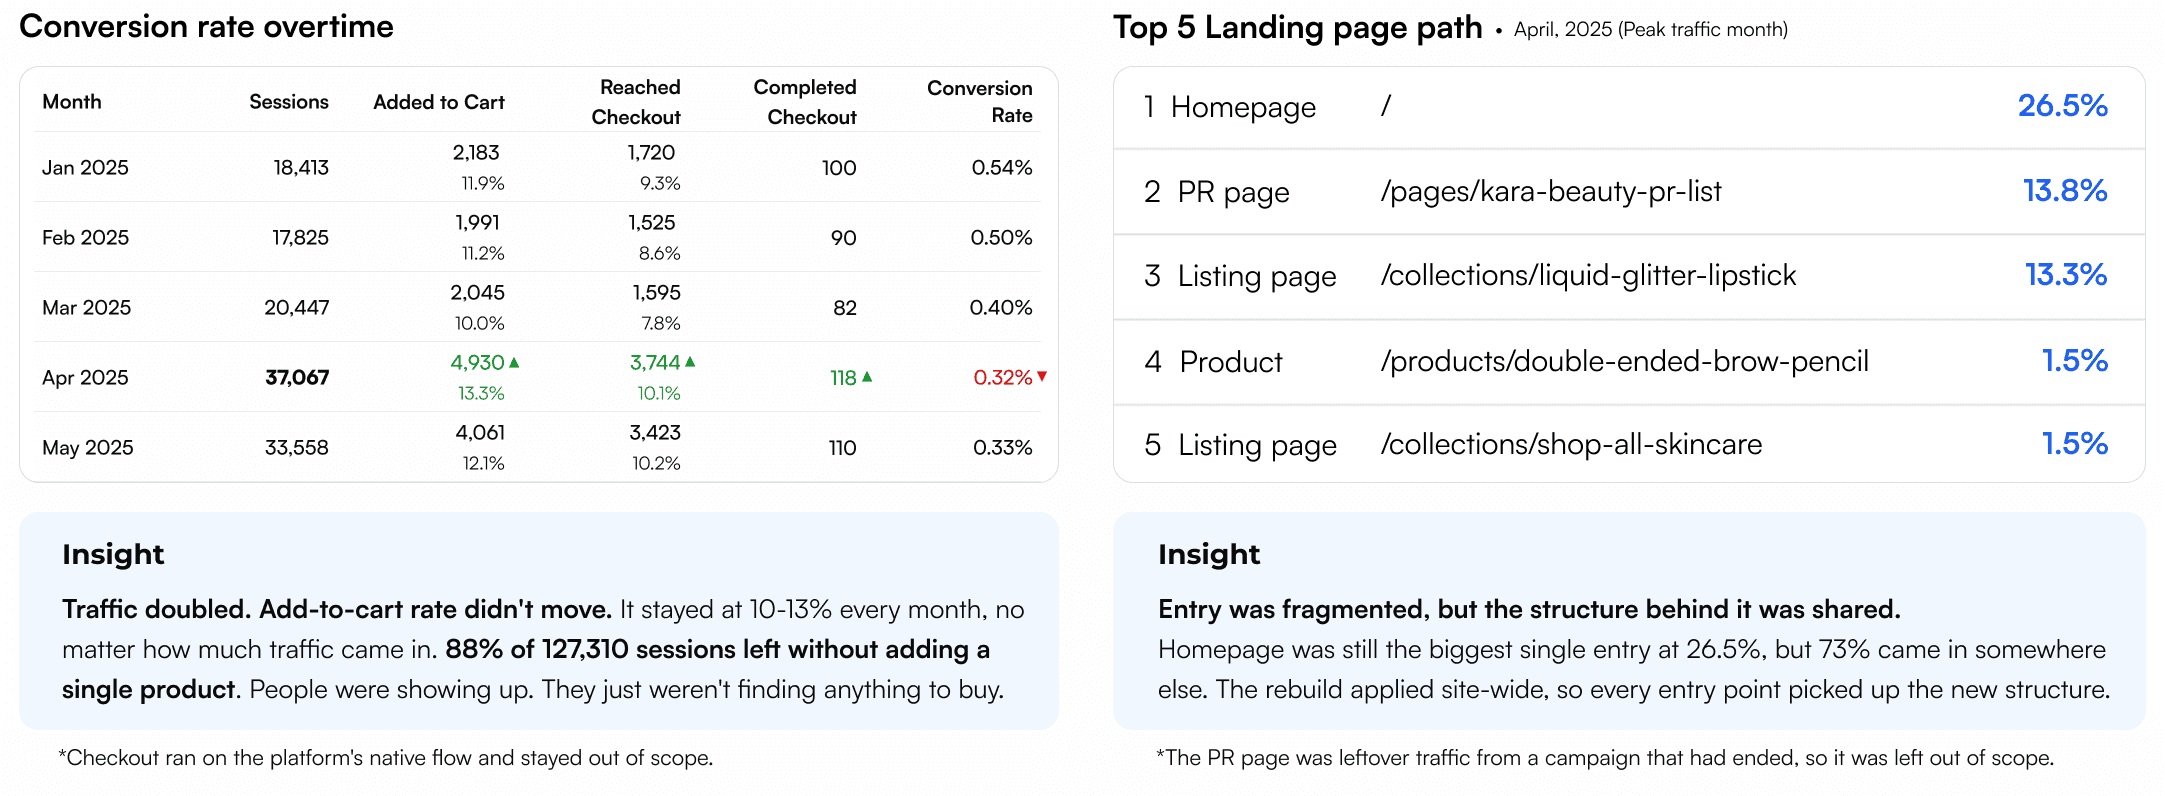
In 2025, marketing spend doubled traffic to Kara Beauty. Purchases barely moved. Sessions went from 18,413 to 37,067 between January and April, but monthly purchases went from 100 to 118, and conversion fell from 0.54% to 0.32%.
The company was paying more for every sale it made.
BEFORE vs AFTER
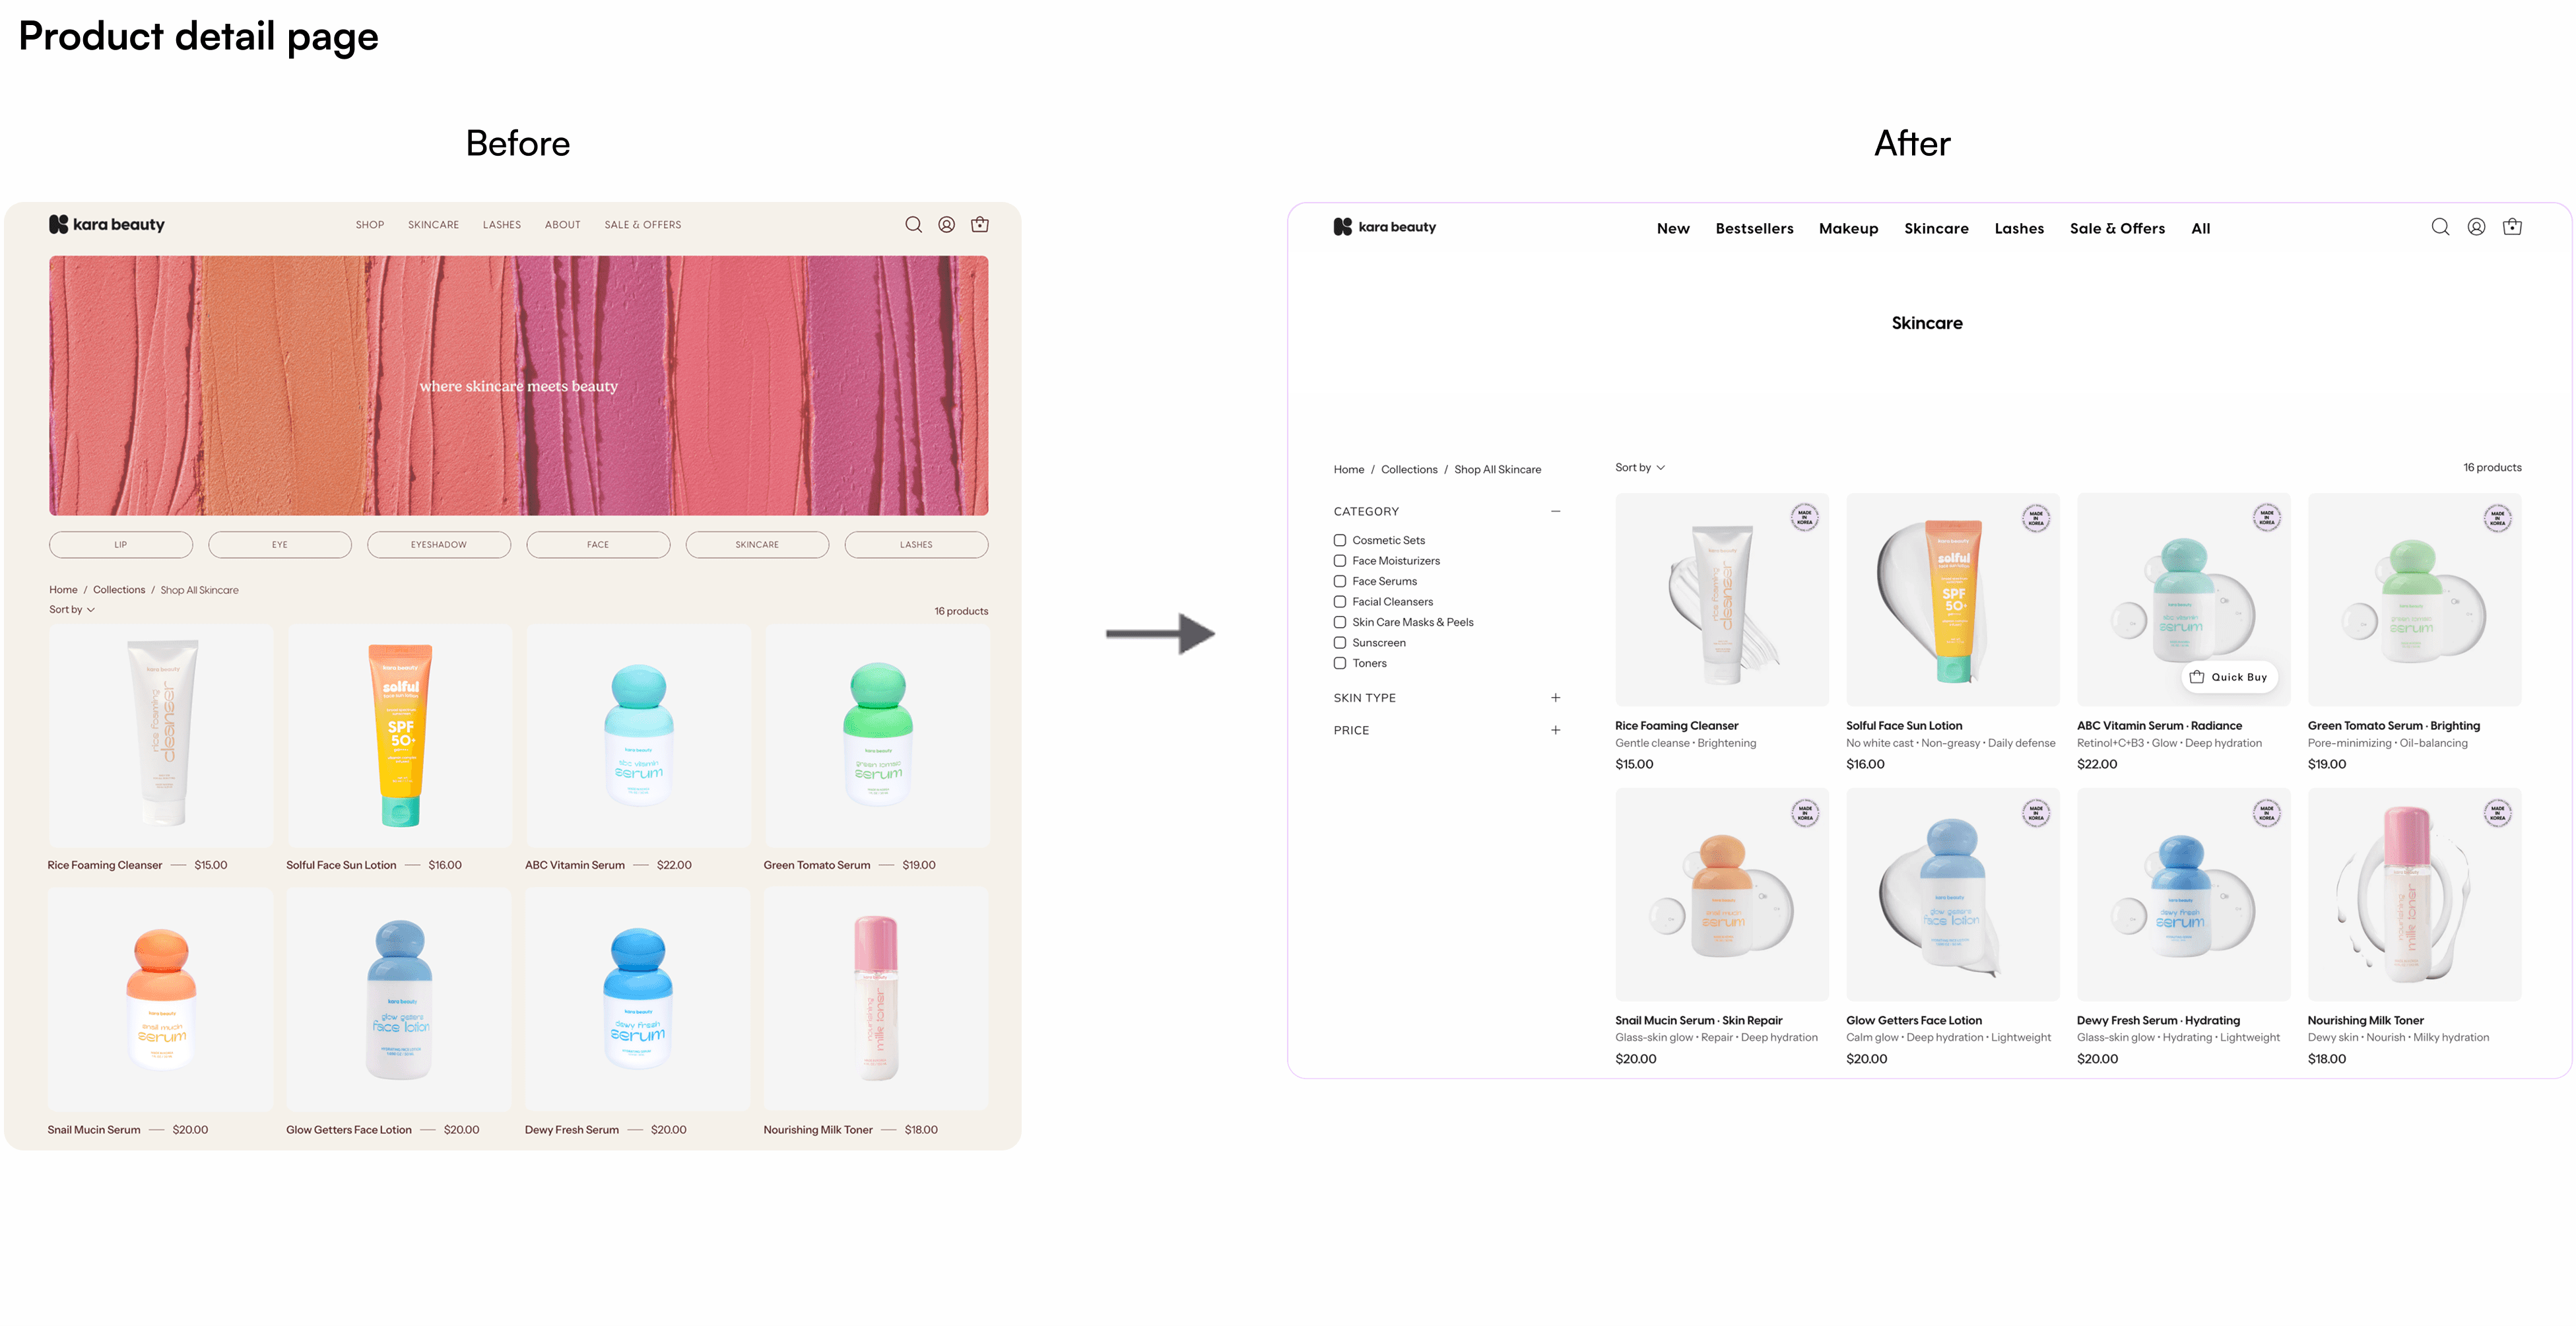
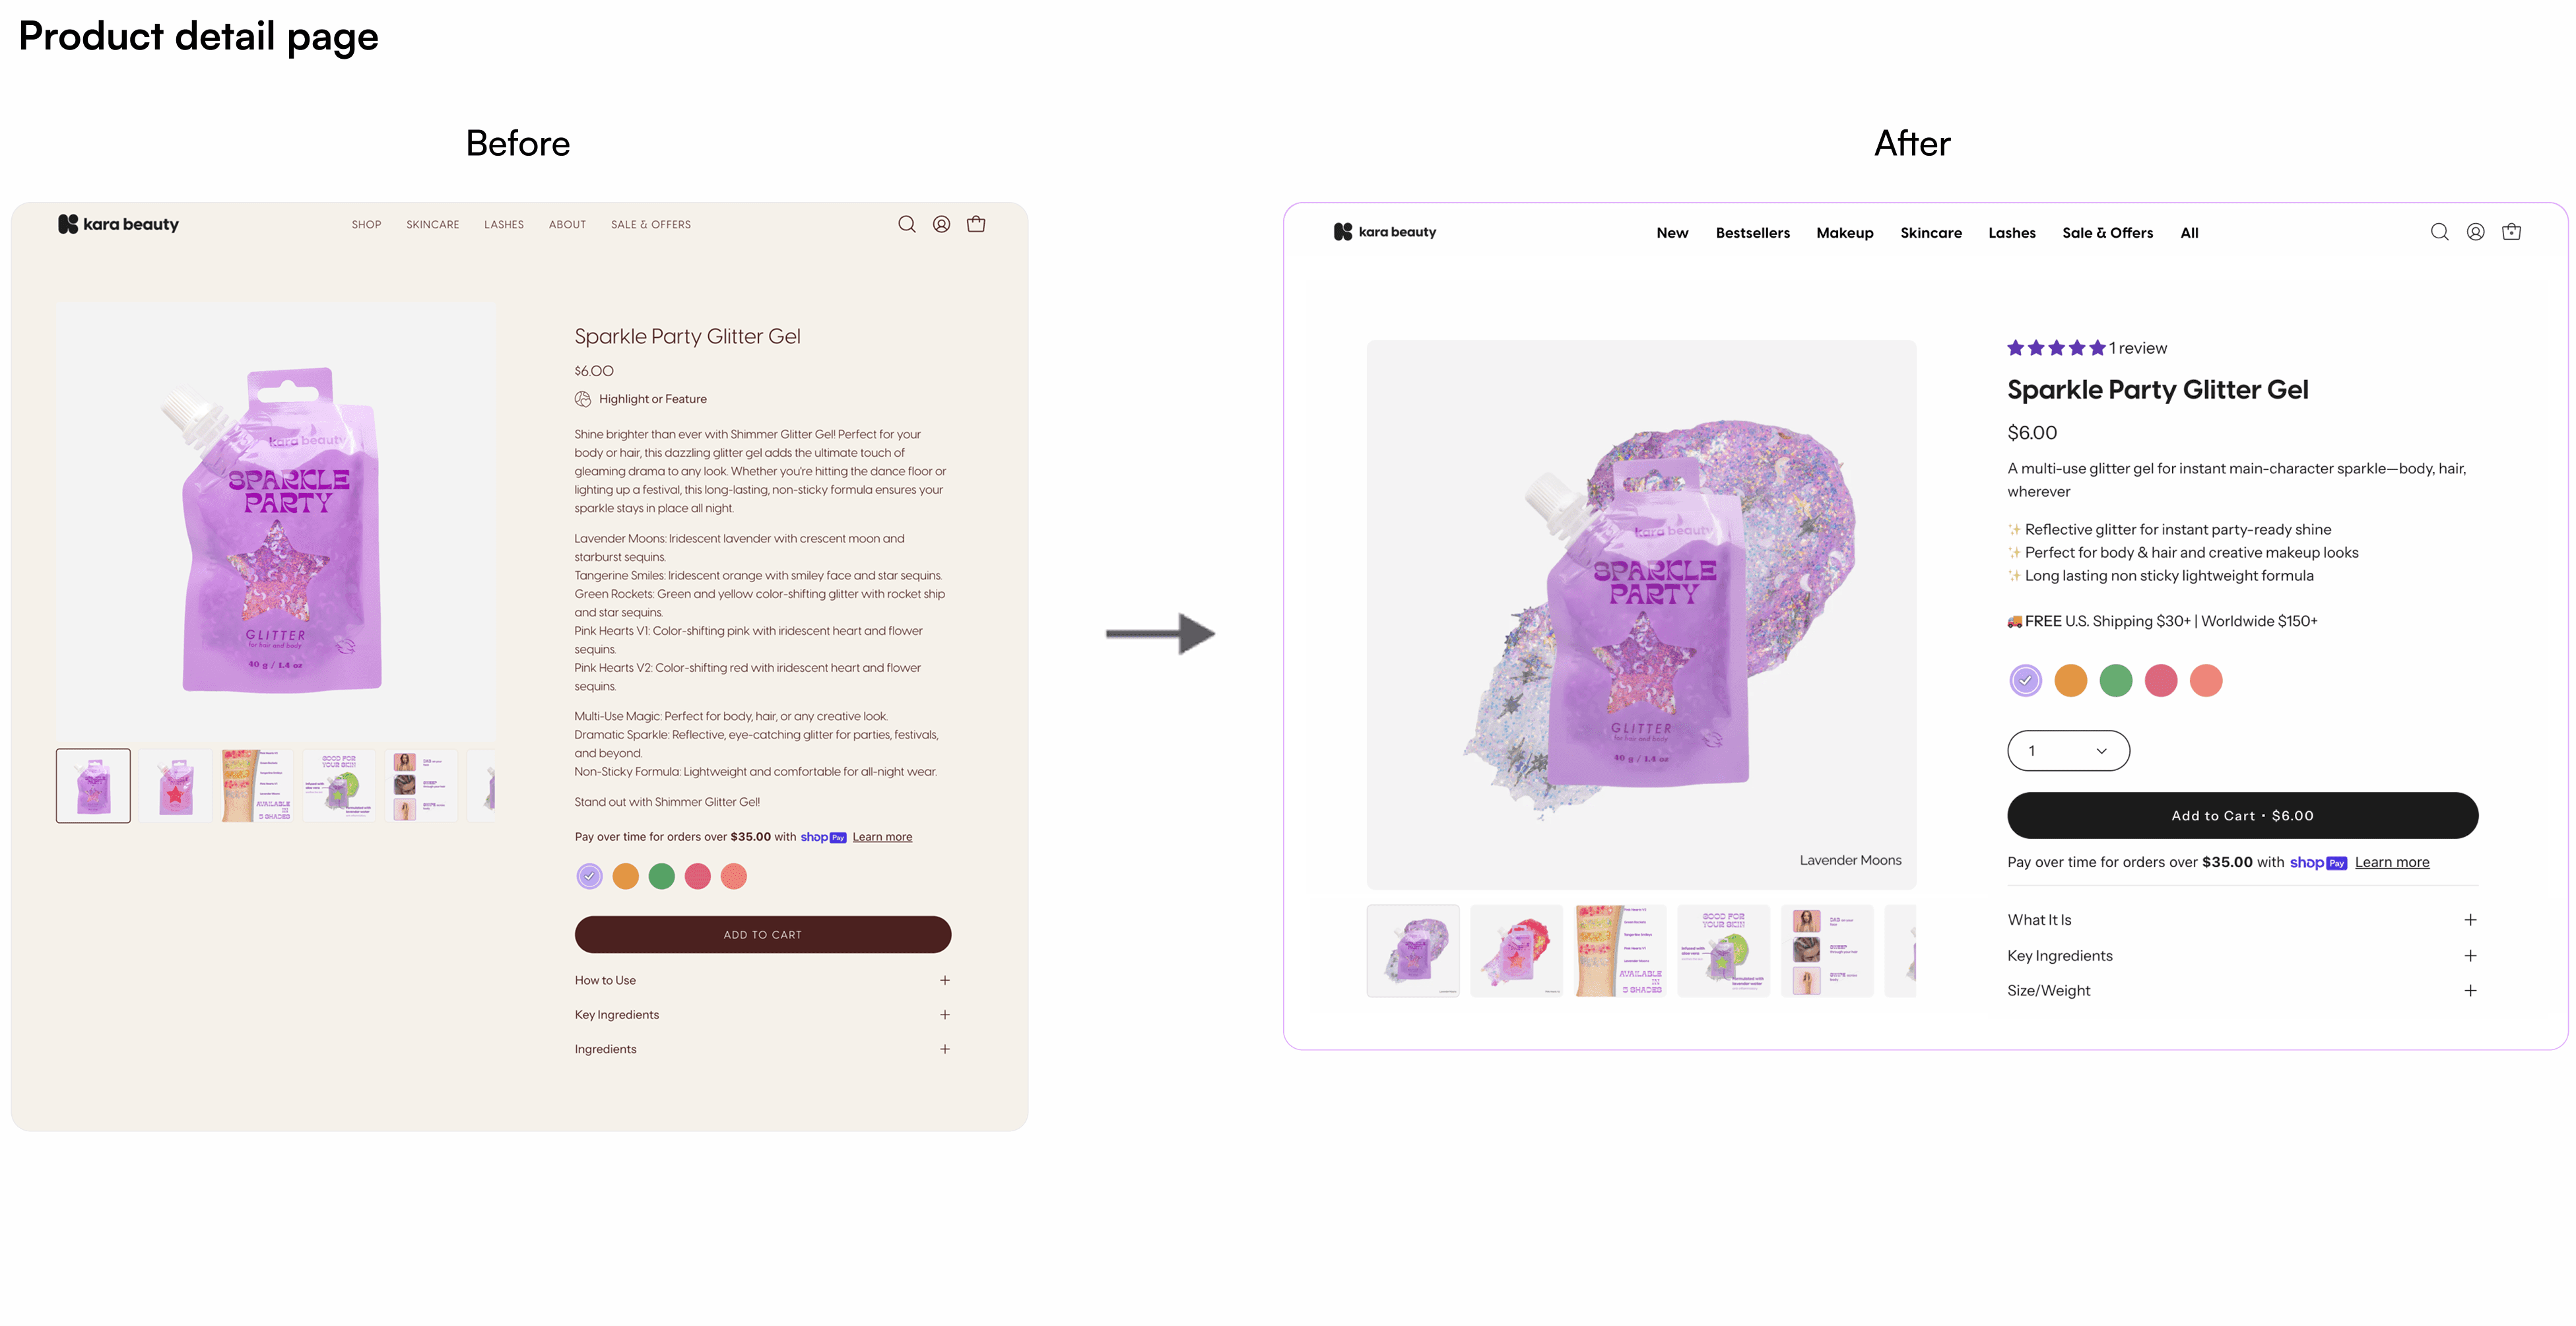
INVESTIGATION
Finding where the journey was breaking down…
Conversion funnel & entry point analysis
Marketing spend was climbing, so I started with the funnel to see which step was losing people. I then looked at where users were landing, since the entry point shapes what they see first.


User flow analysis
I walked the path a first-time buyer takes, from landing to add-to-cart, to find where the flow stops guiding them.

Insight
Traffic wasn't the problem. The interface was. At every step users had to guess where to start, how to compare, and when to decide, and each guess cost a little more intent. That is where the 88% were lost.
User interview
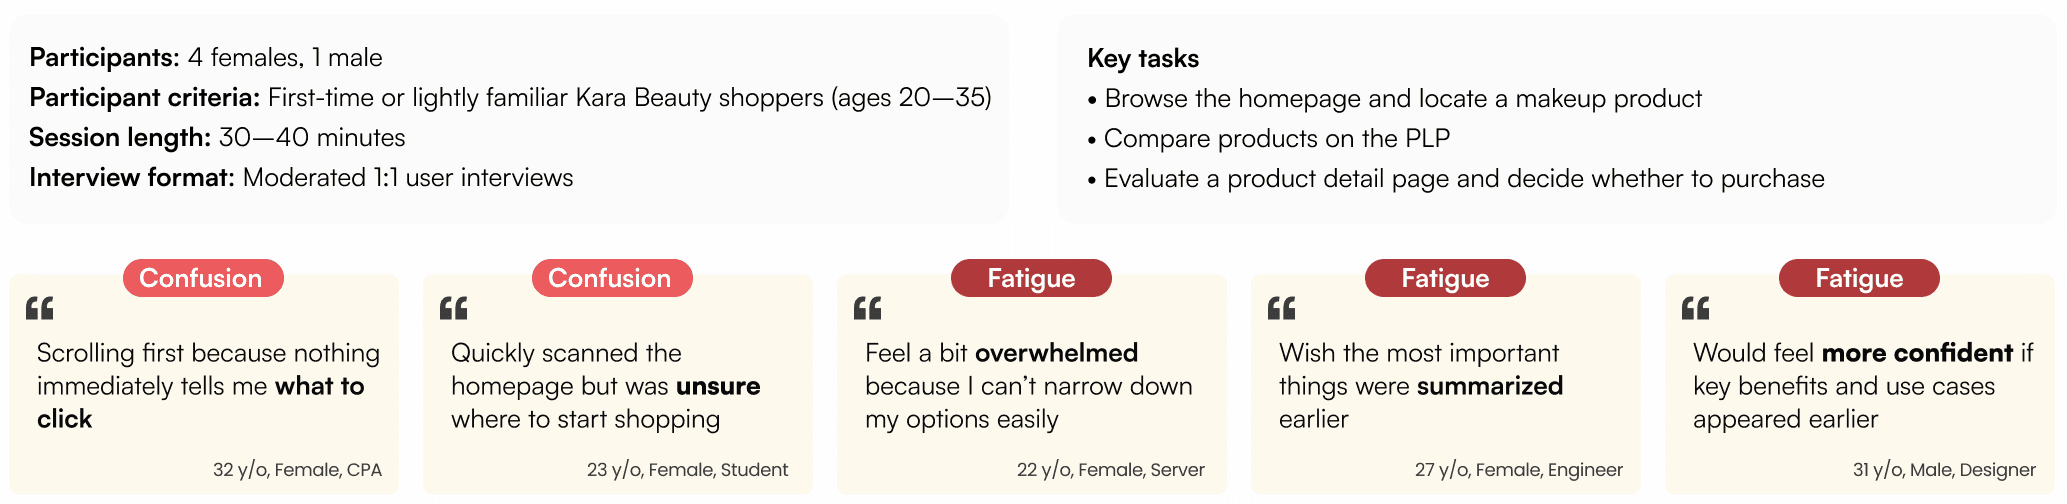
To validate whether the lack of structure identified in analytics actually showed up in real user decision-making, I conducted moderated user interviews.
Insight
The interviews point to a confidence gap. Users left because the interface drained their decision-making energy. Missing orientation created Confusion, and hidden benefits created Fatigue. Neither is a content problem.
UX Audit: The dead zone
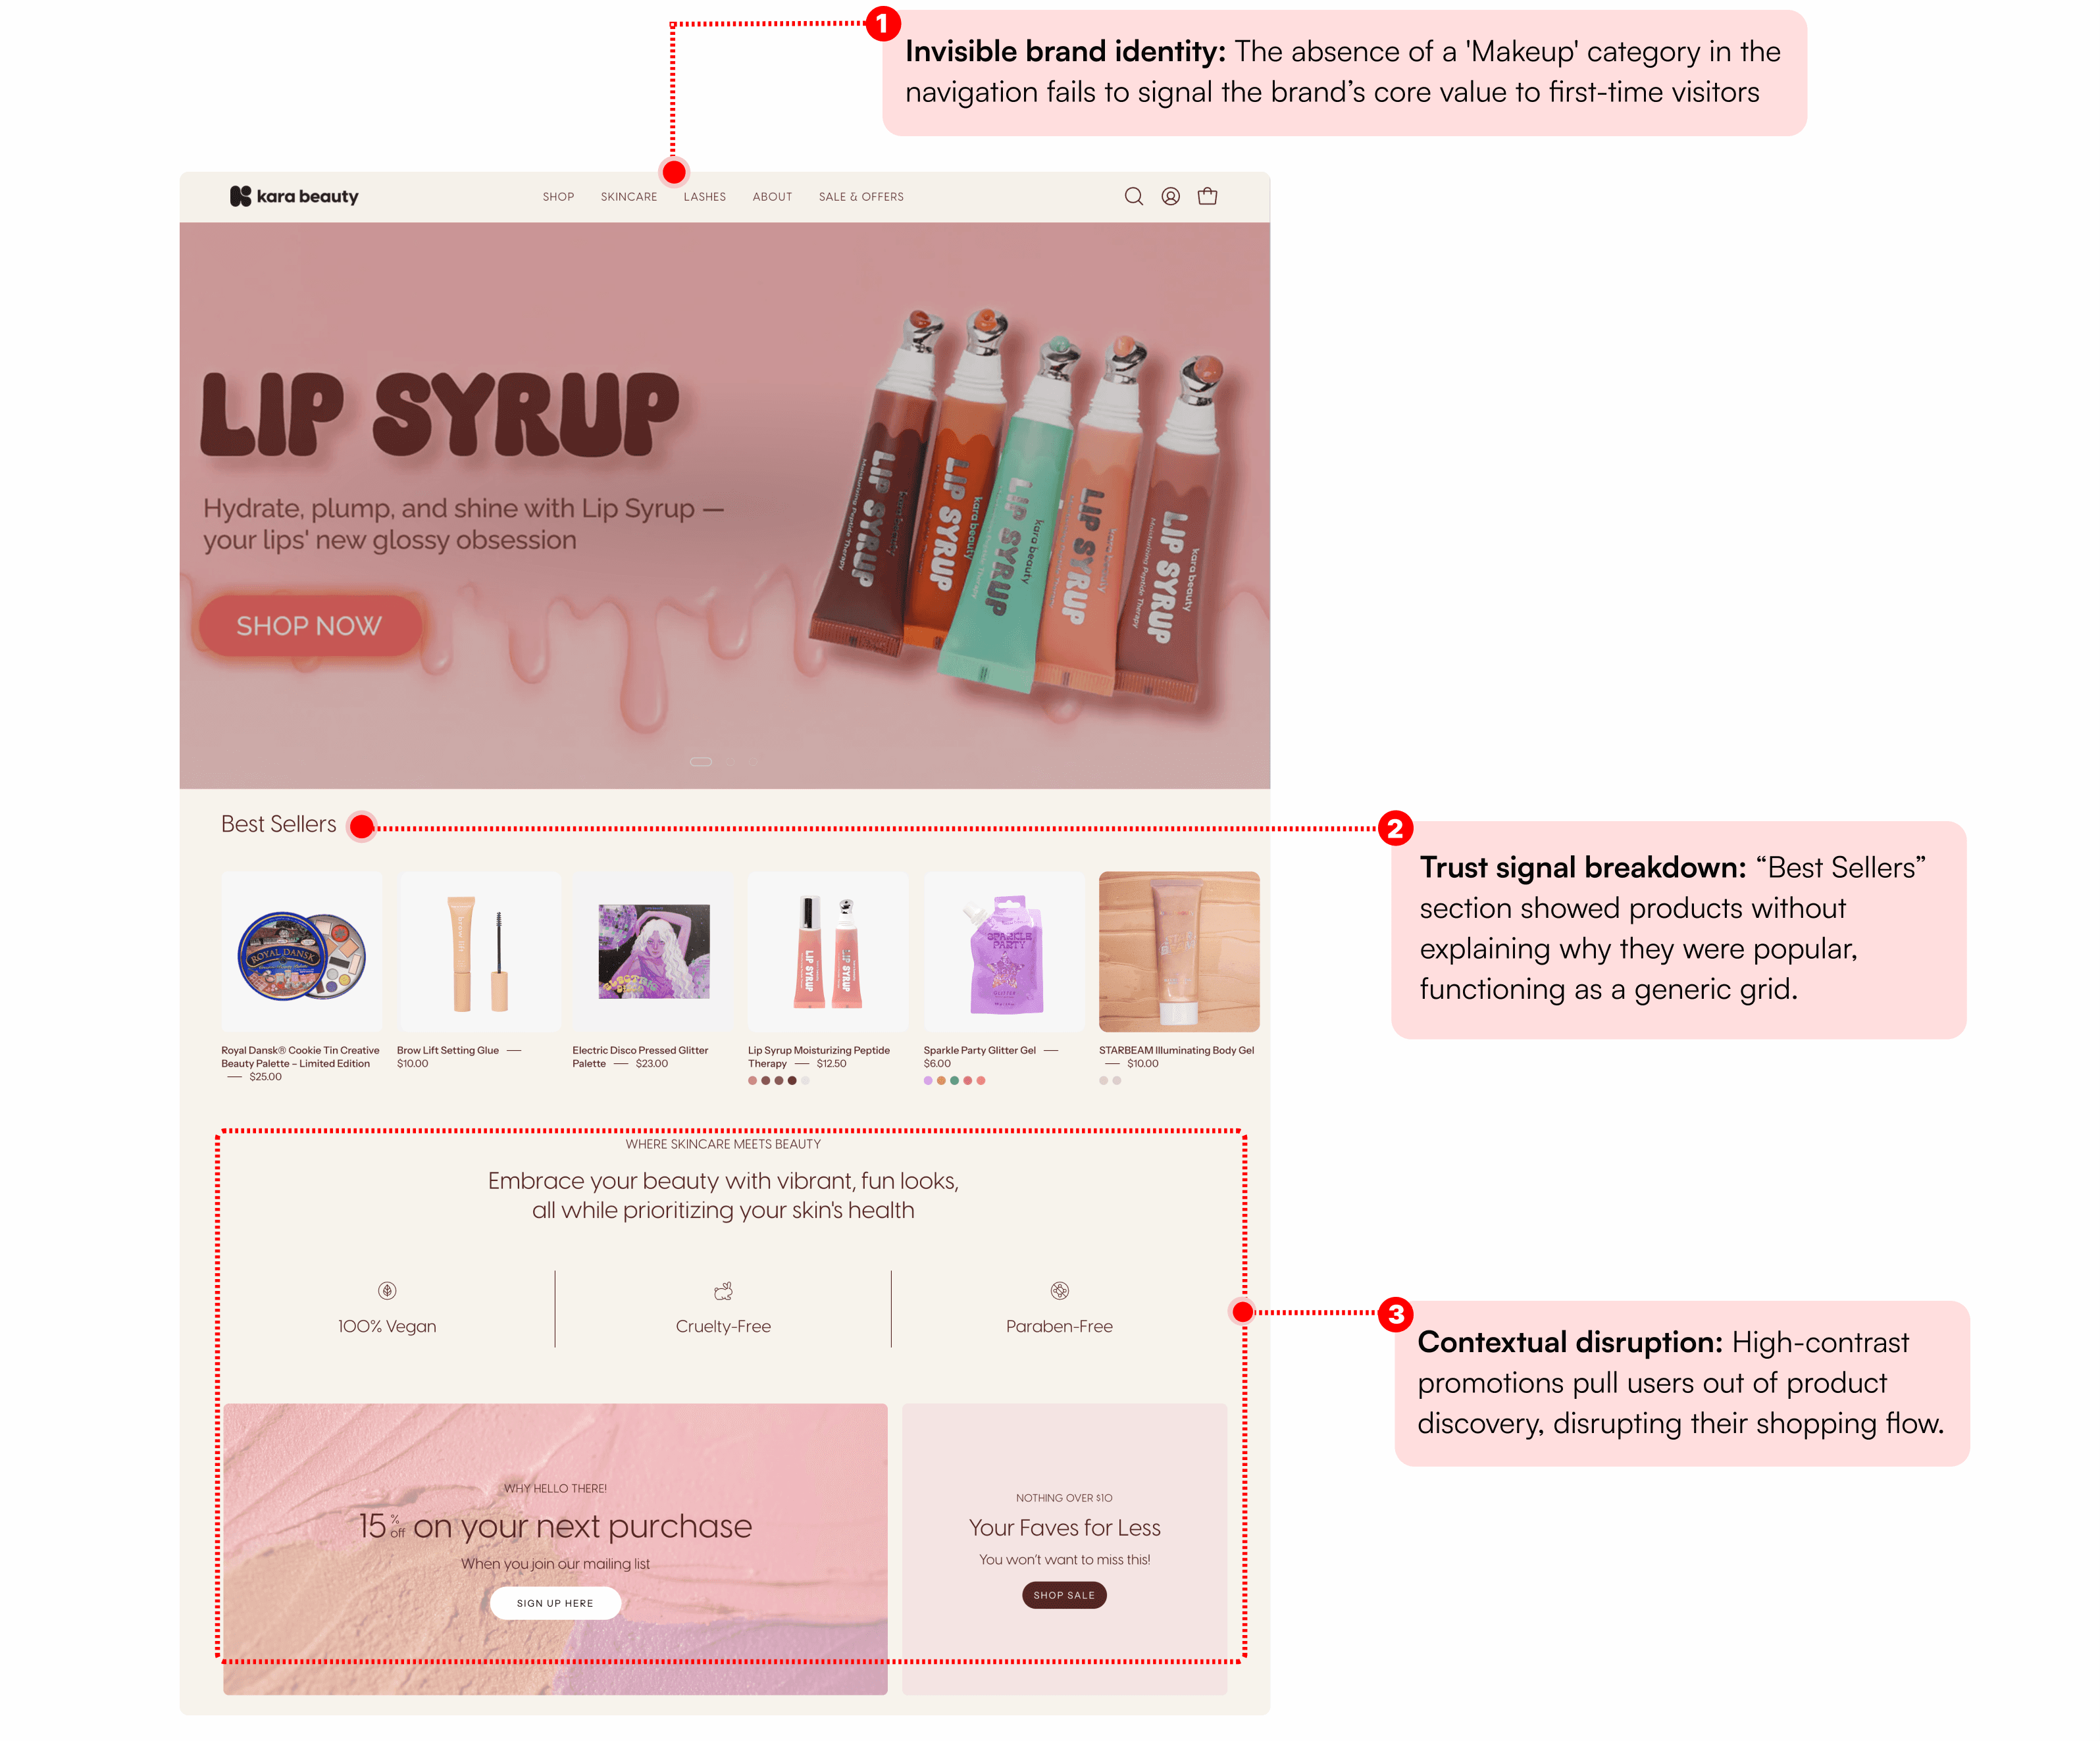
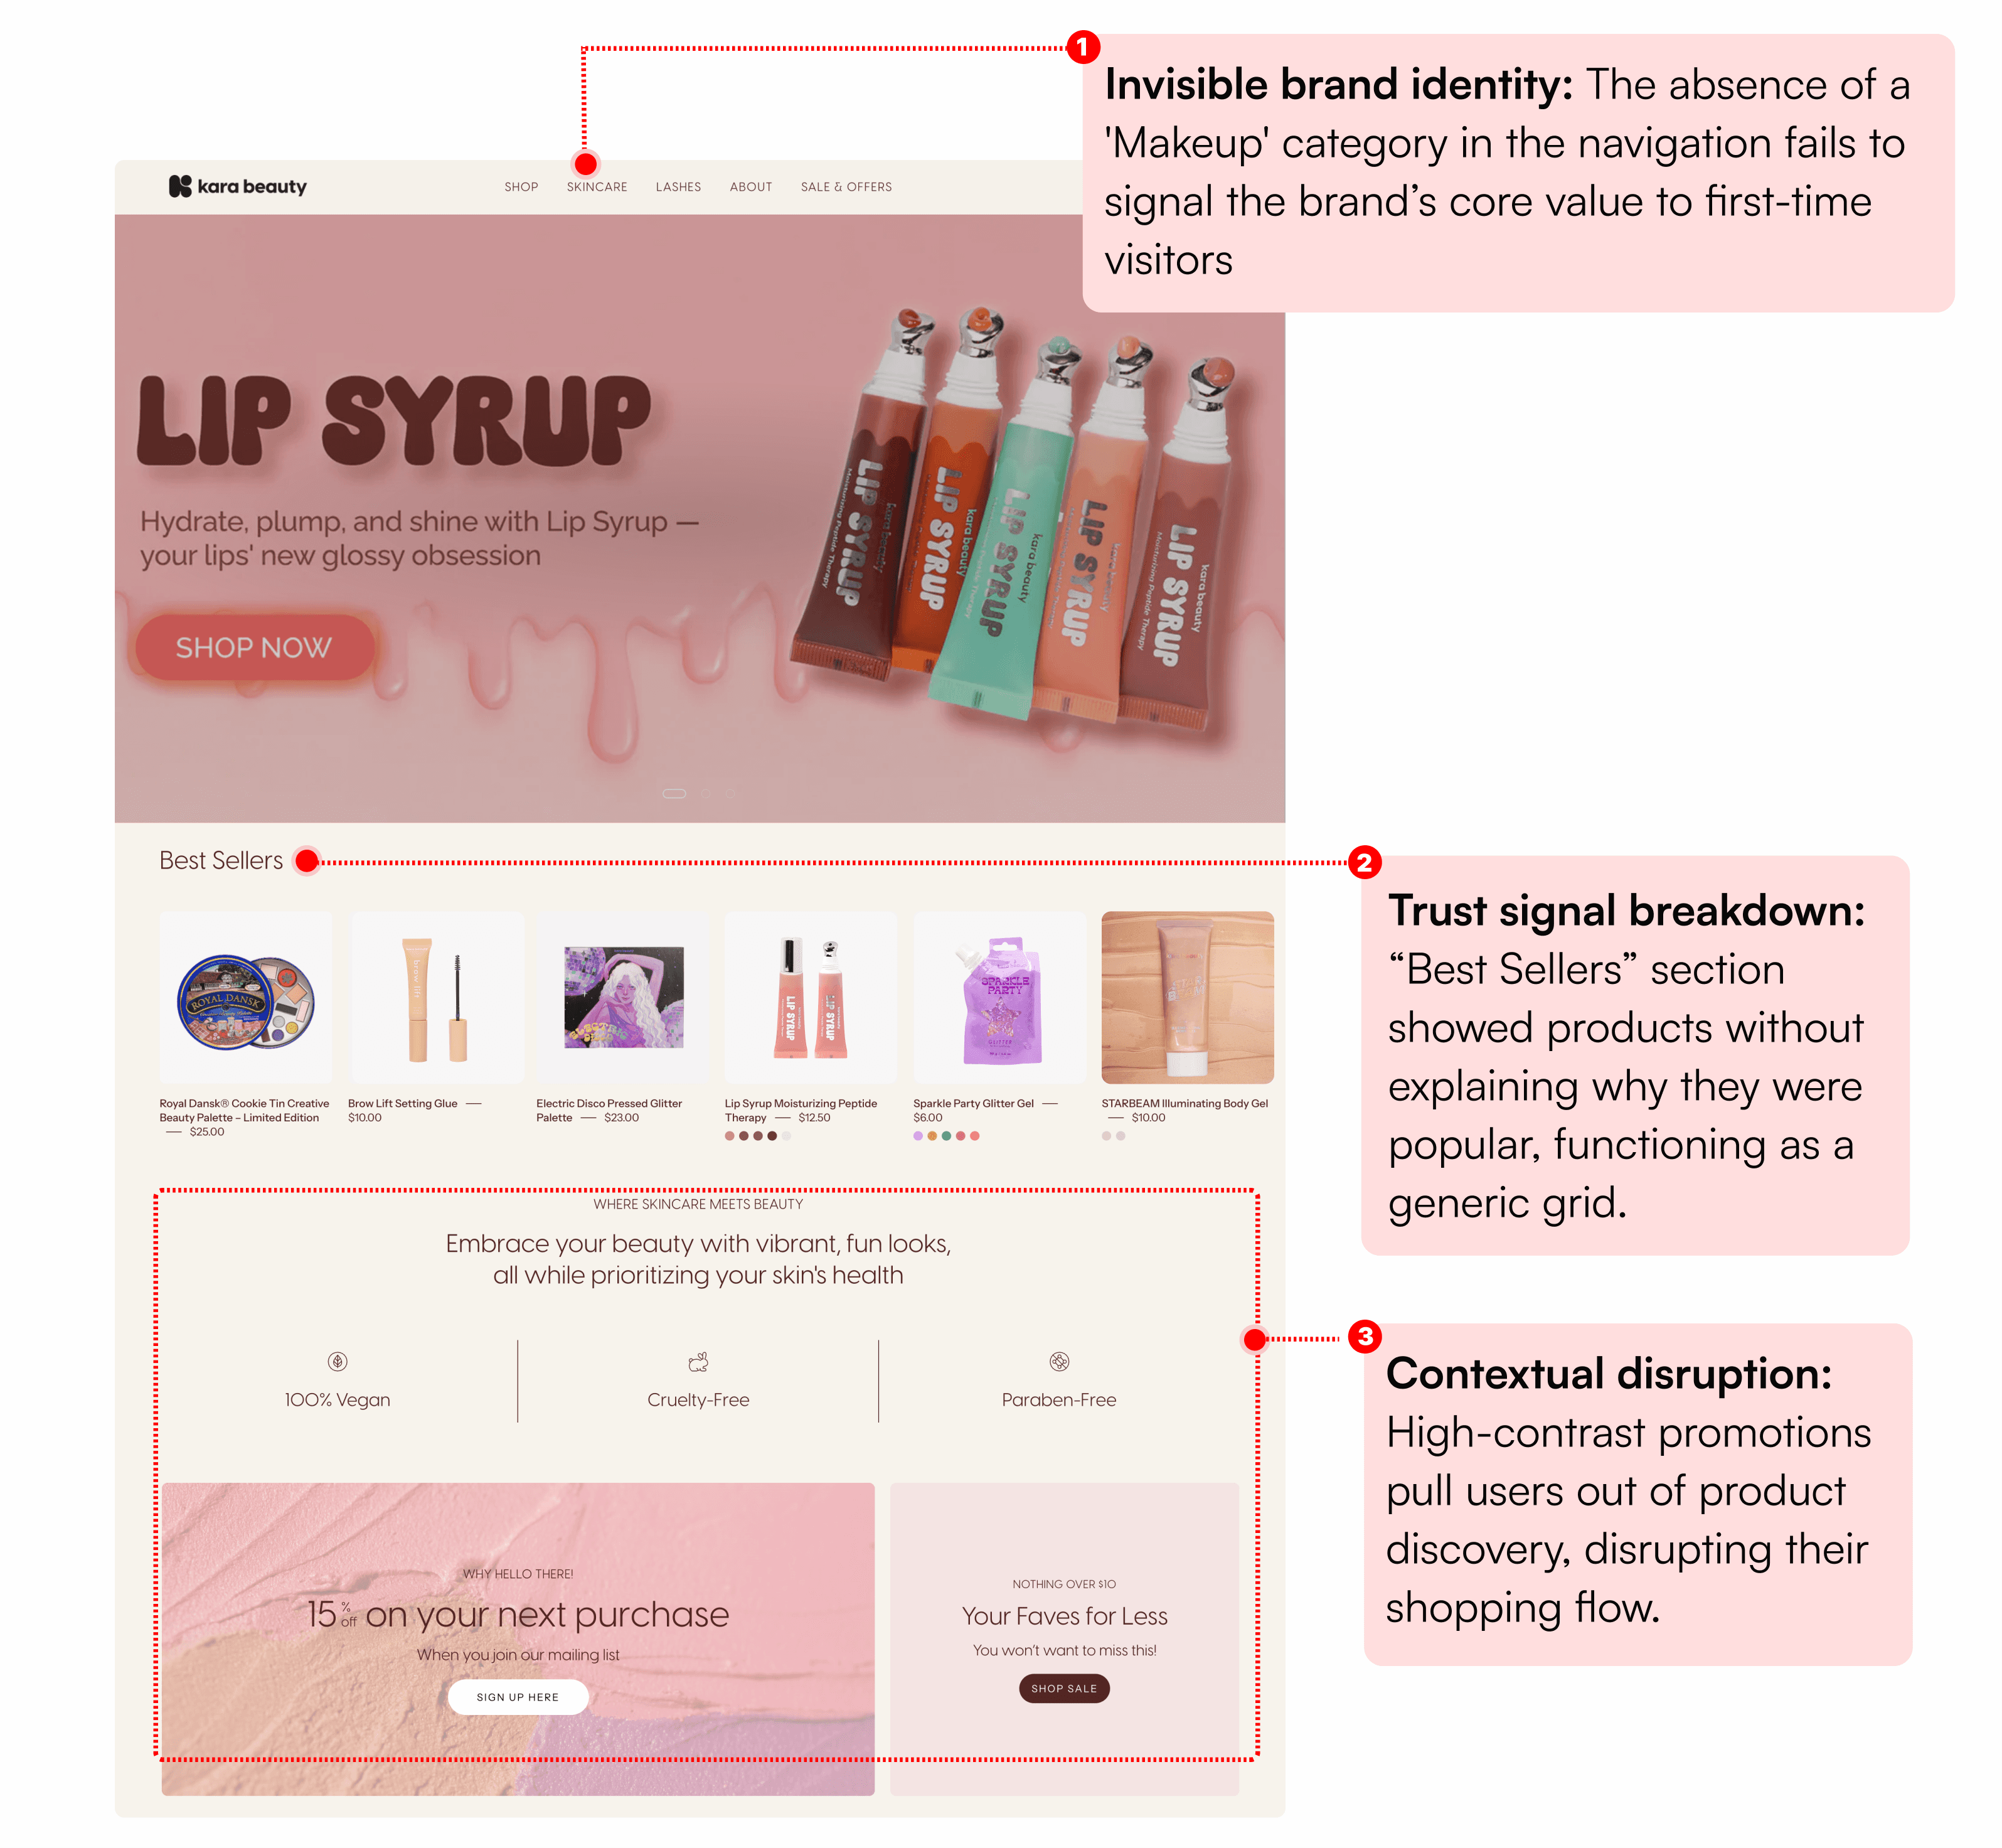
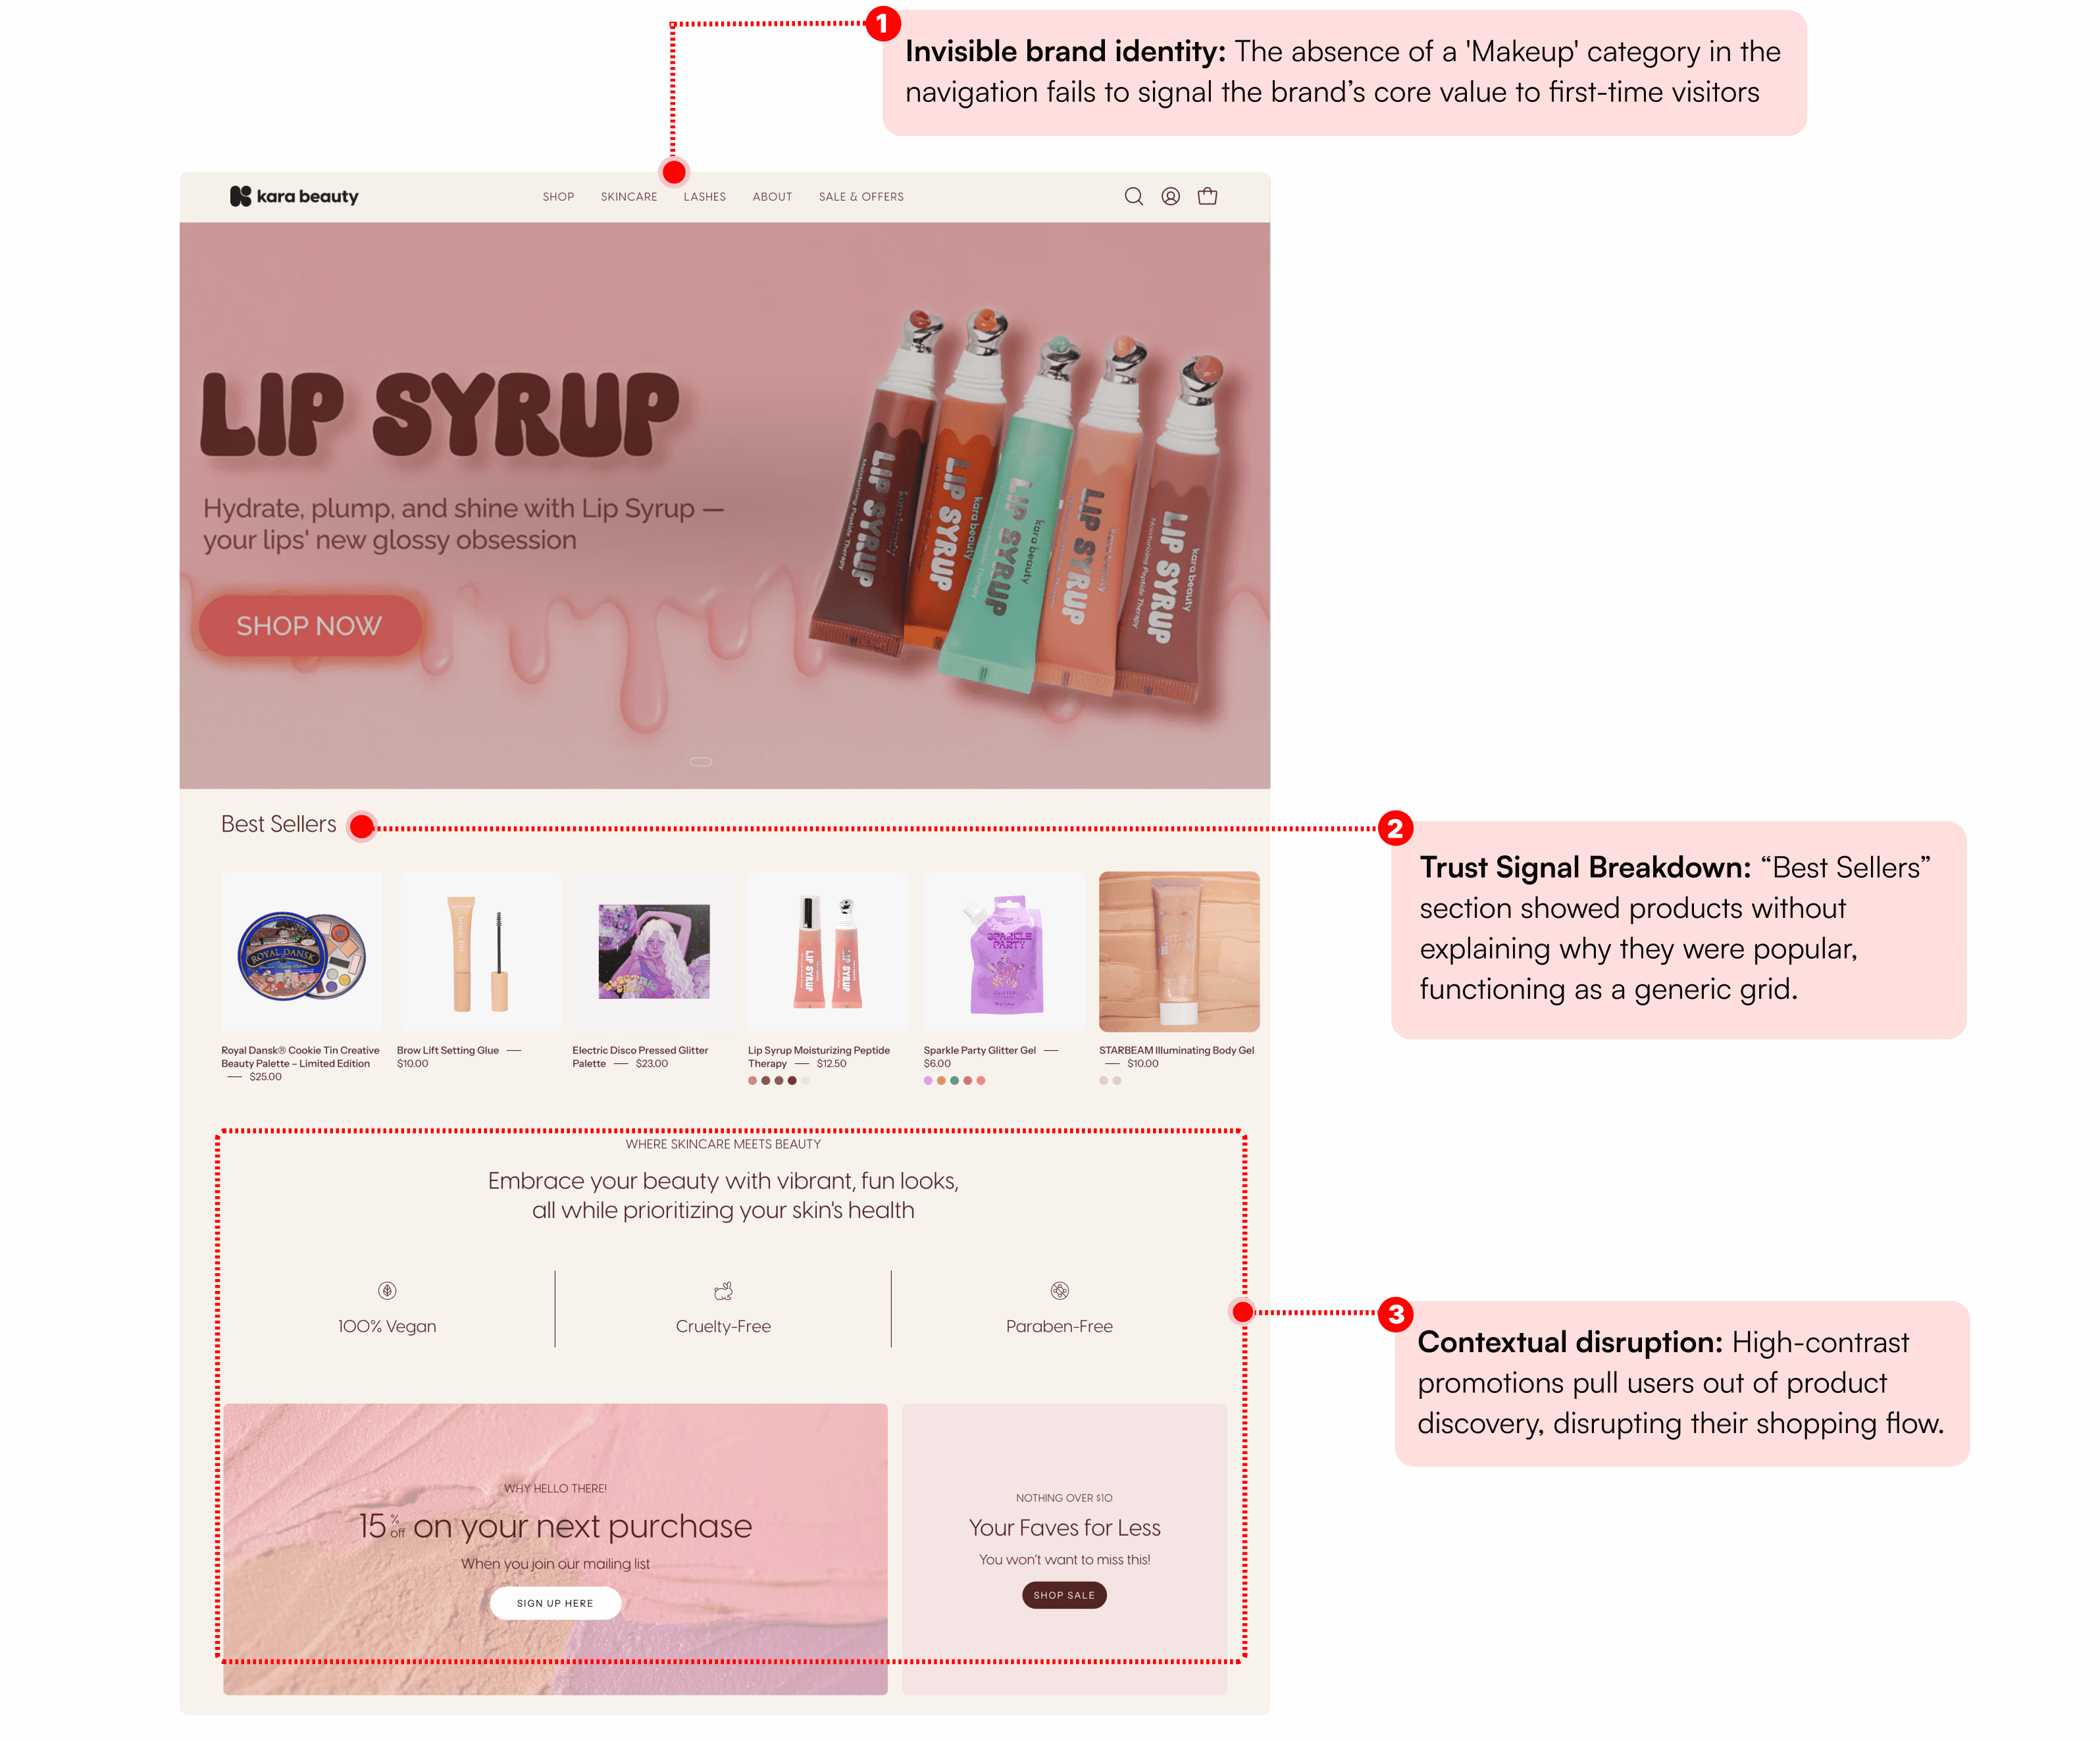
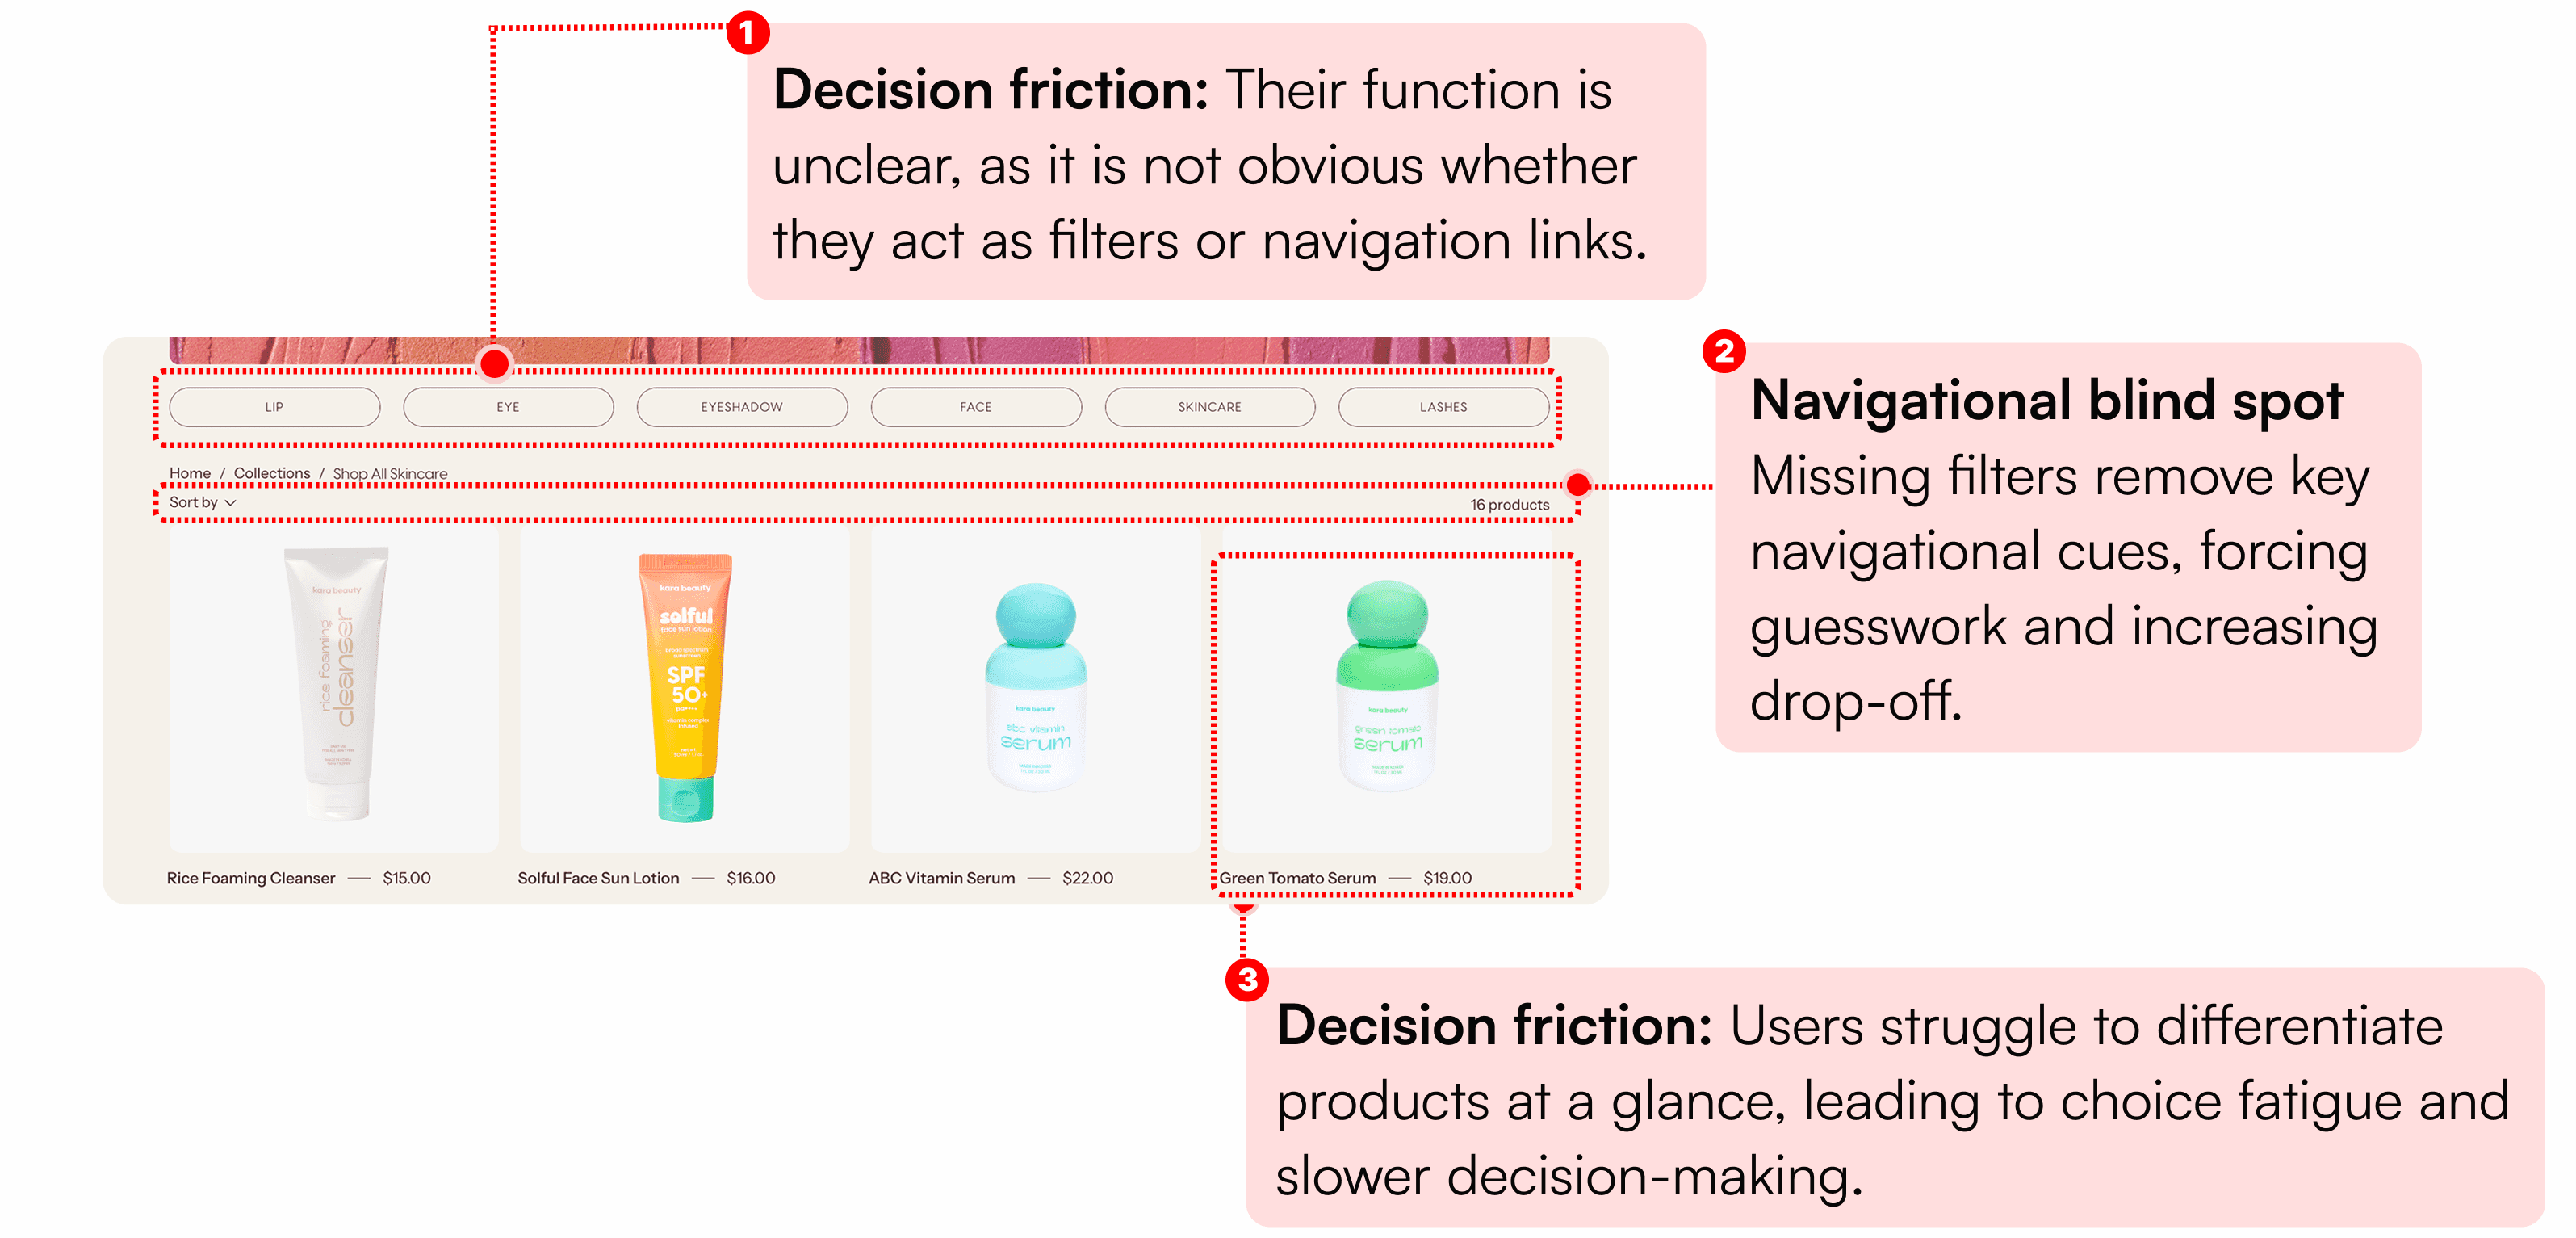
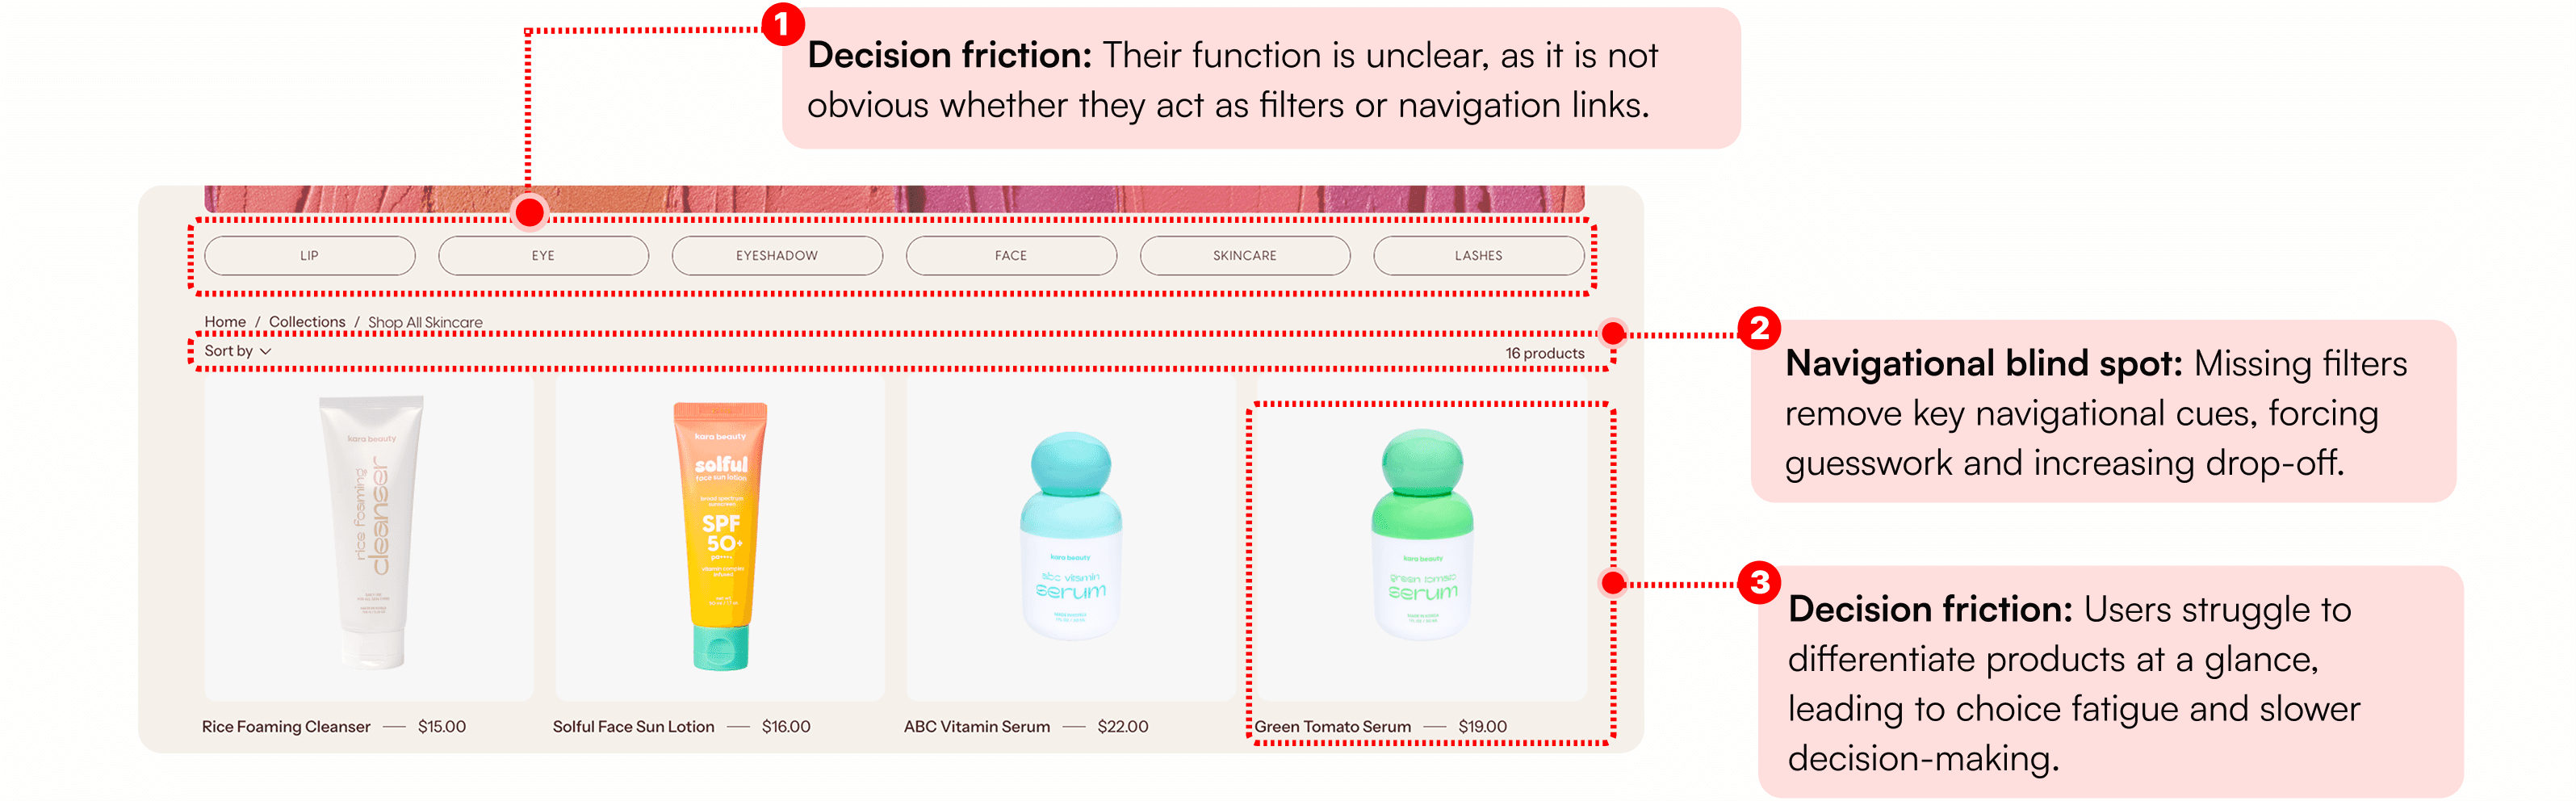
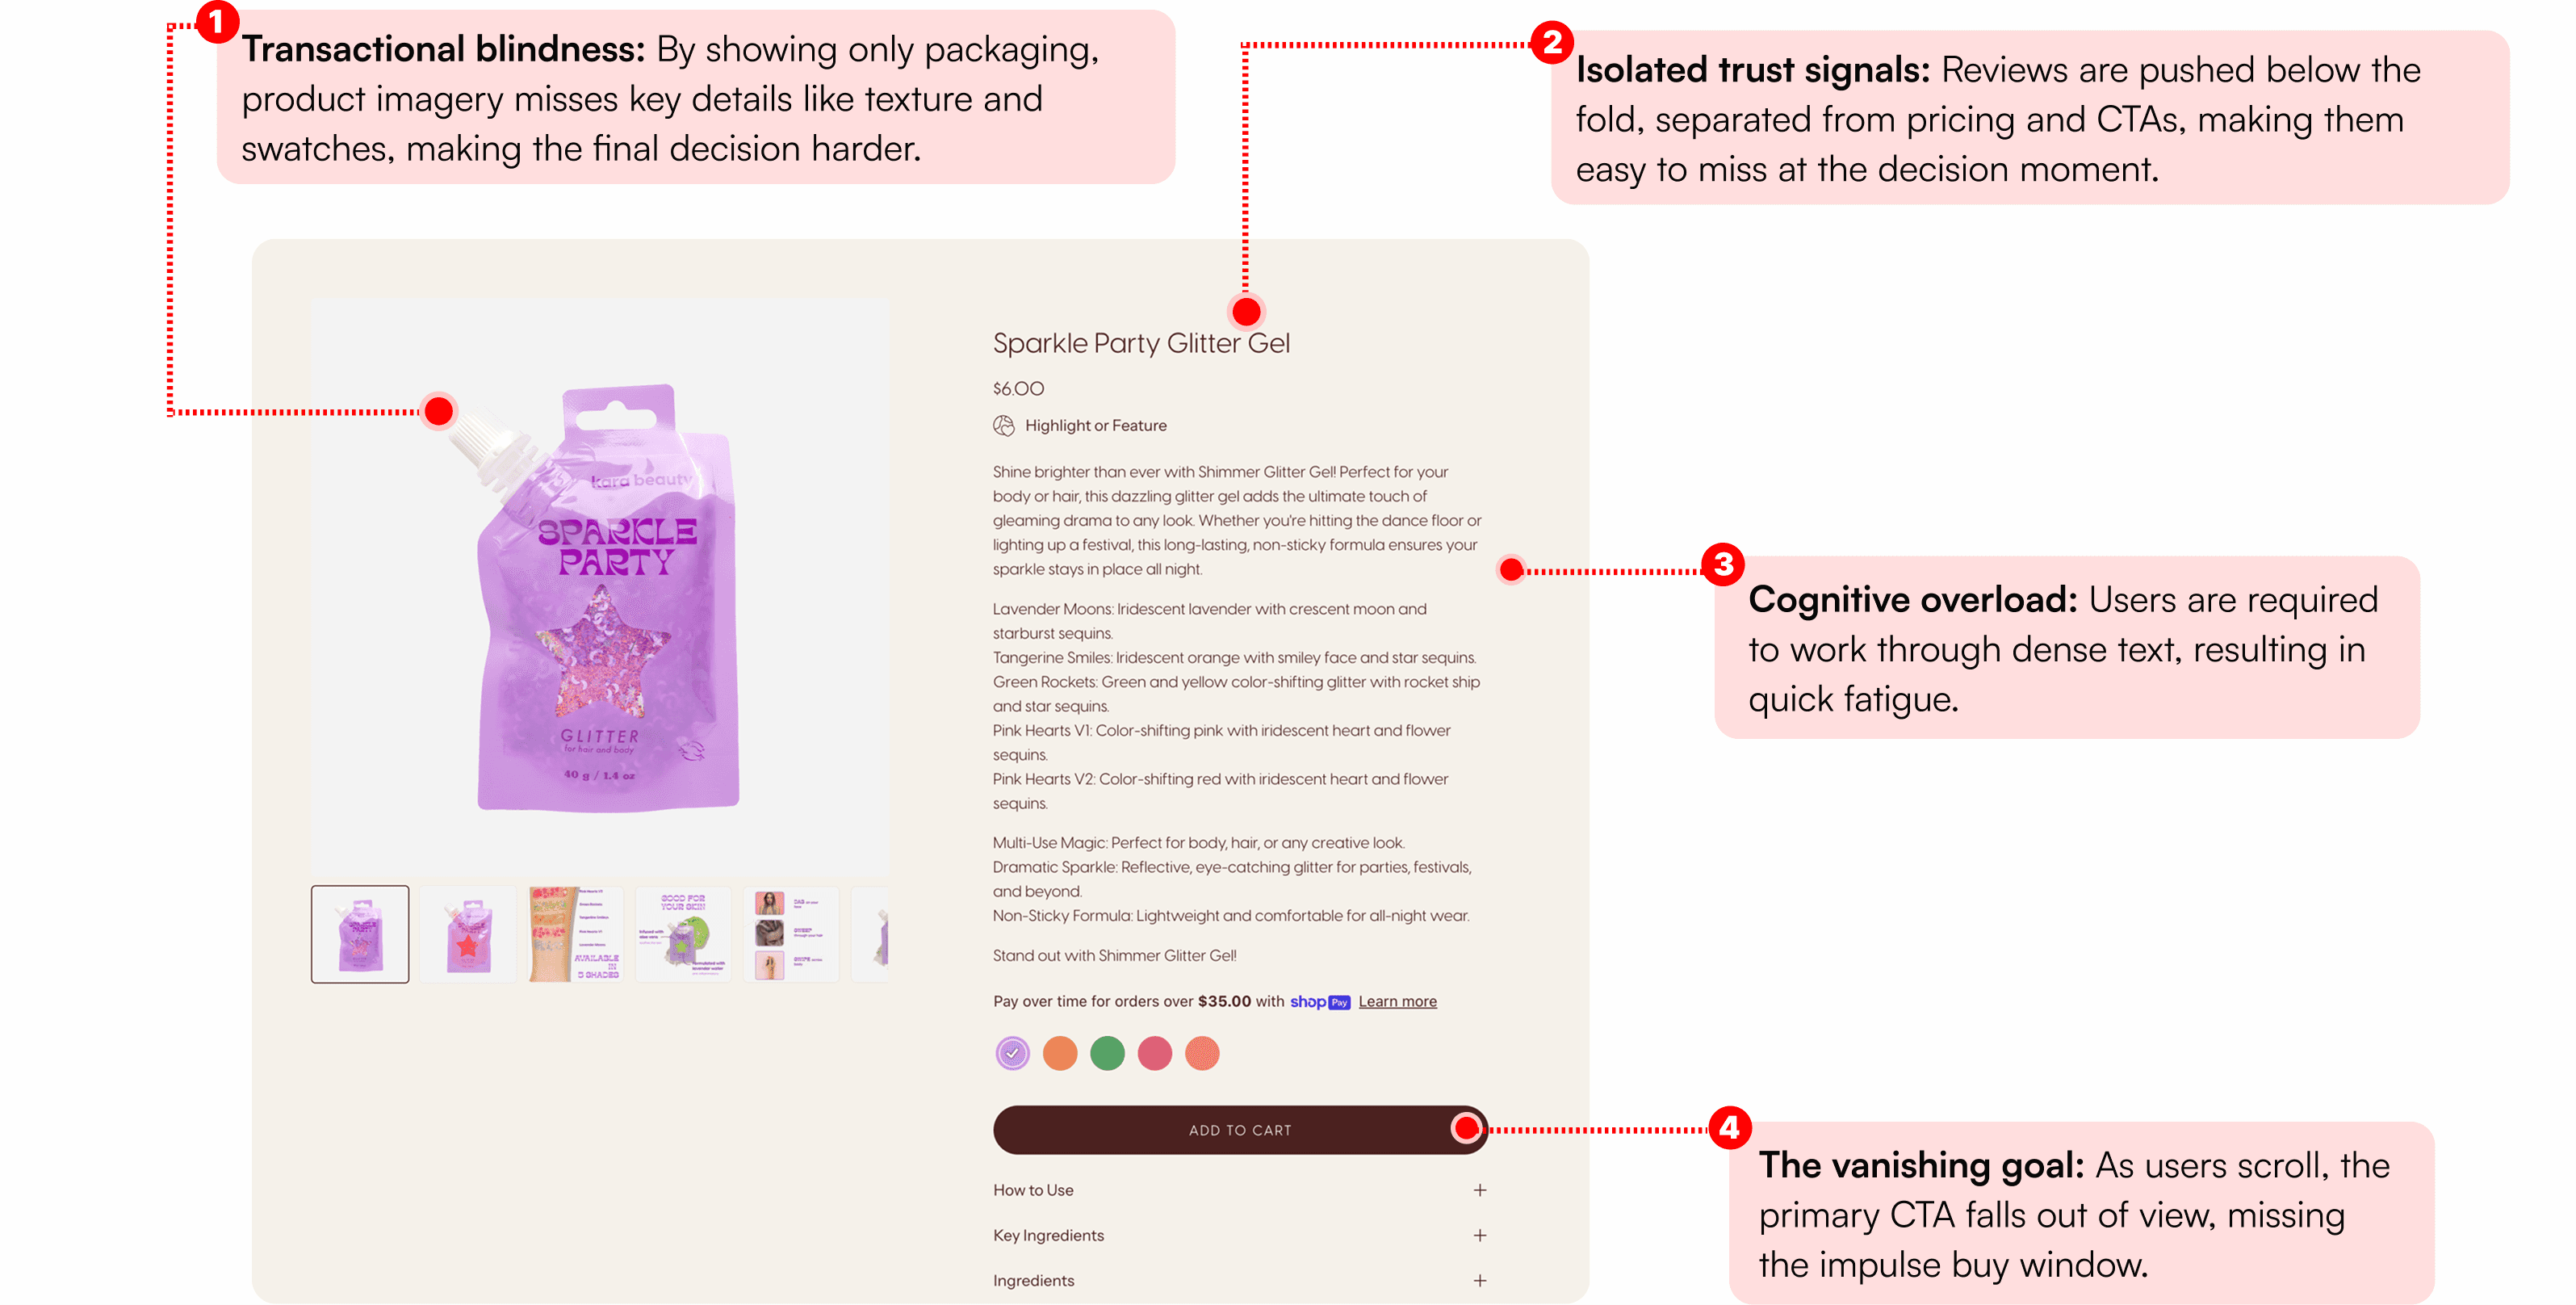
The following audit breaks down 'The Dead Zone', the structural friction and navigational blind spots that turn high-intent entry traffic into immediate exits.
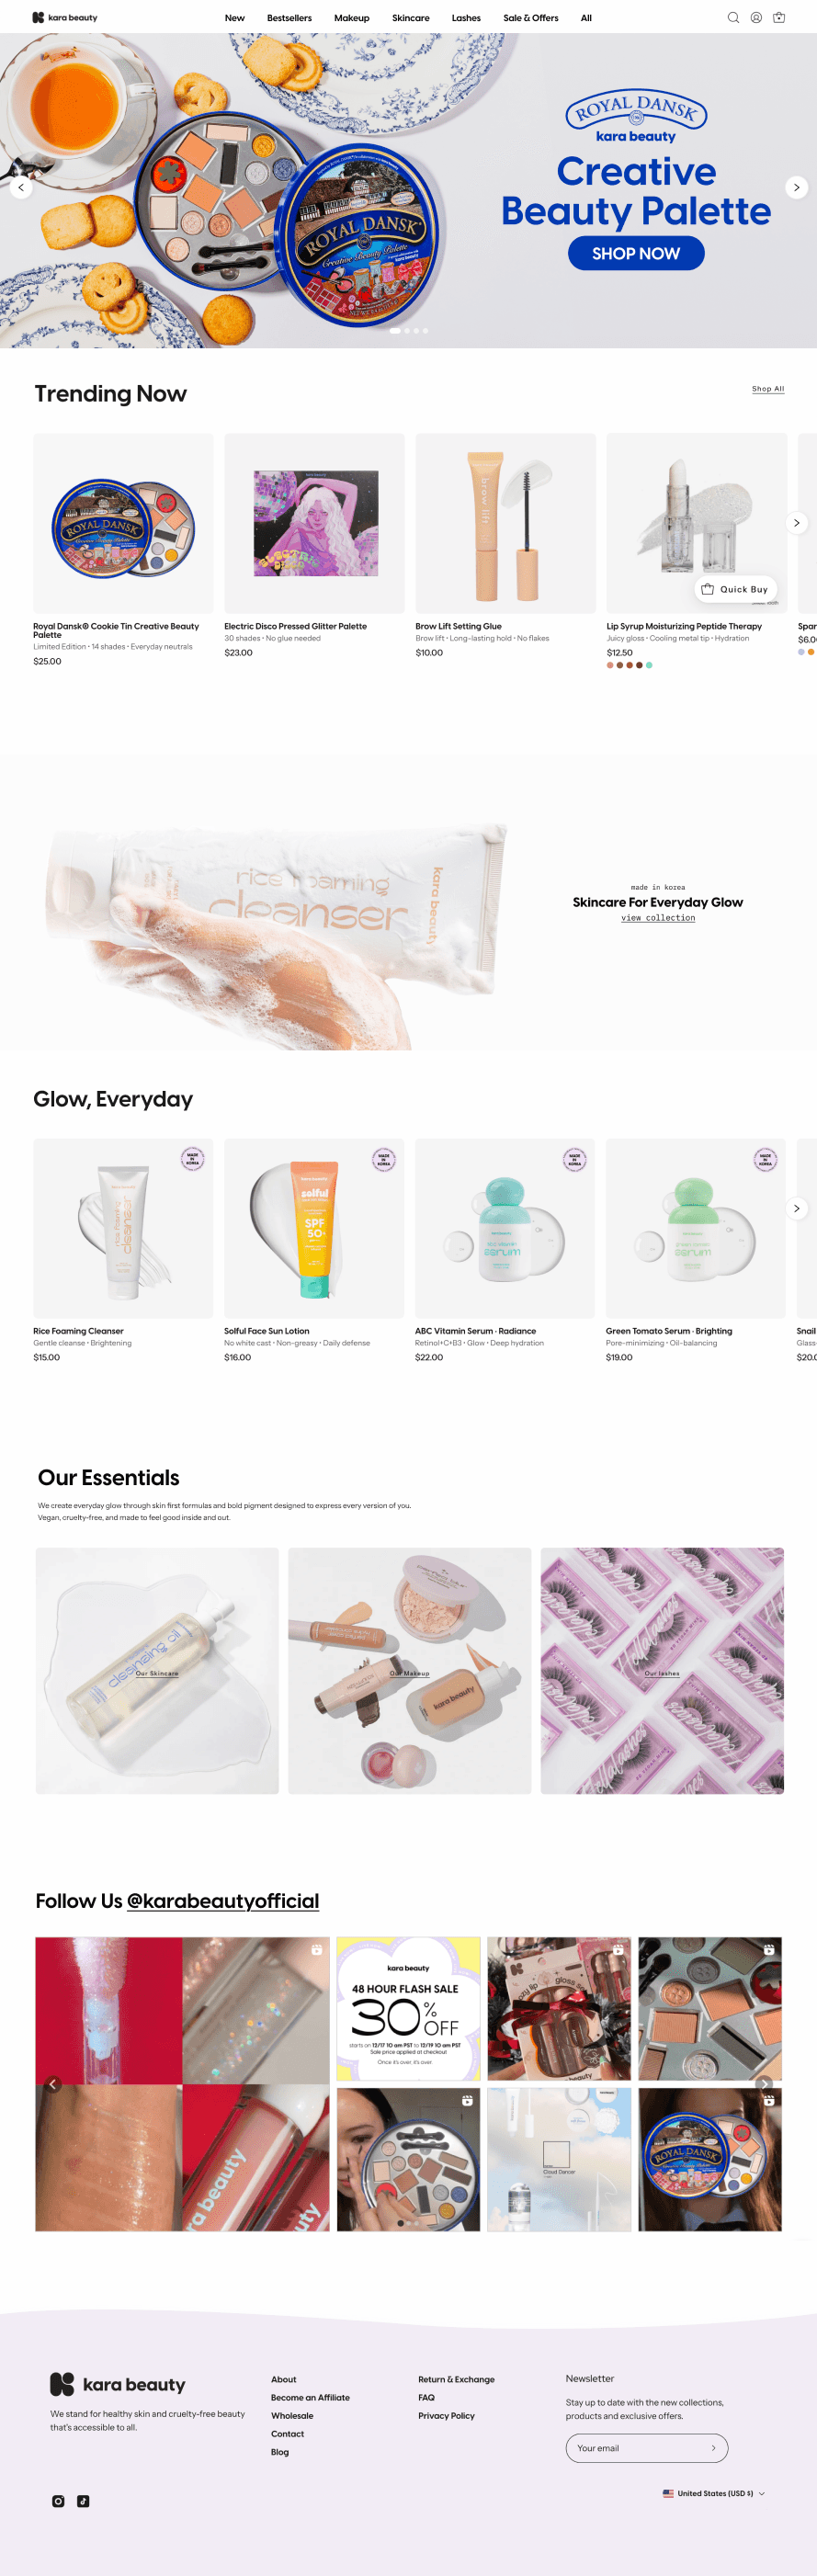
Discovery - Home page:
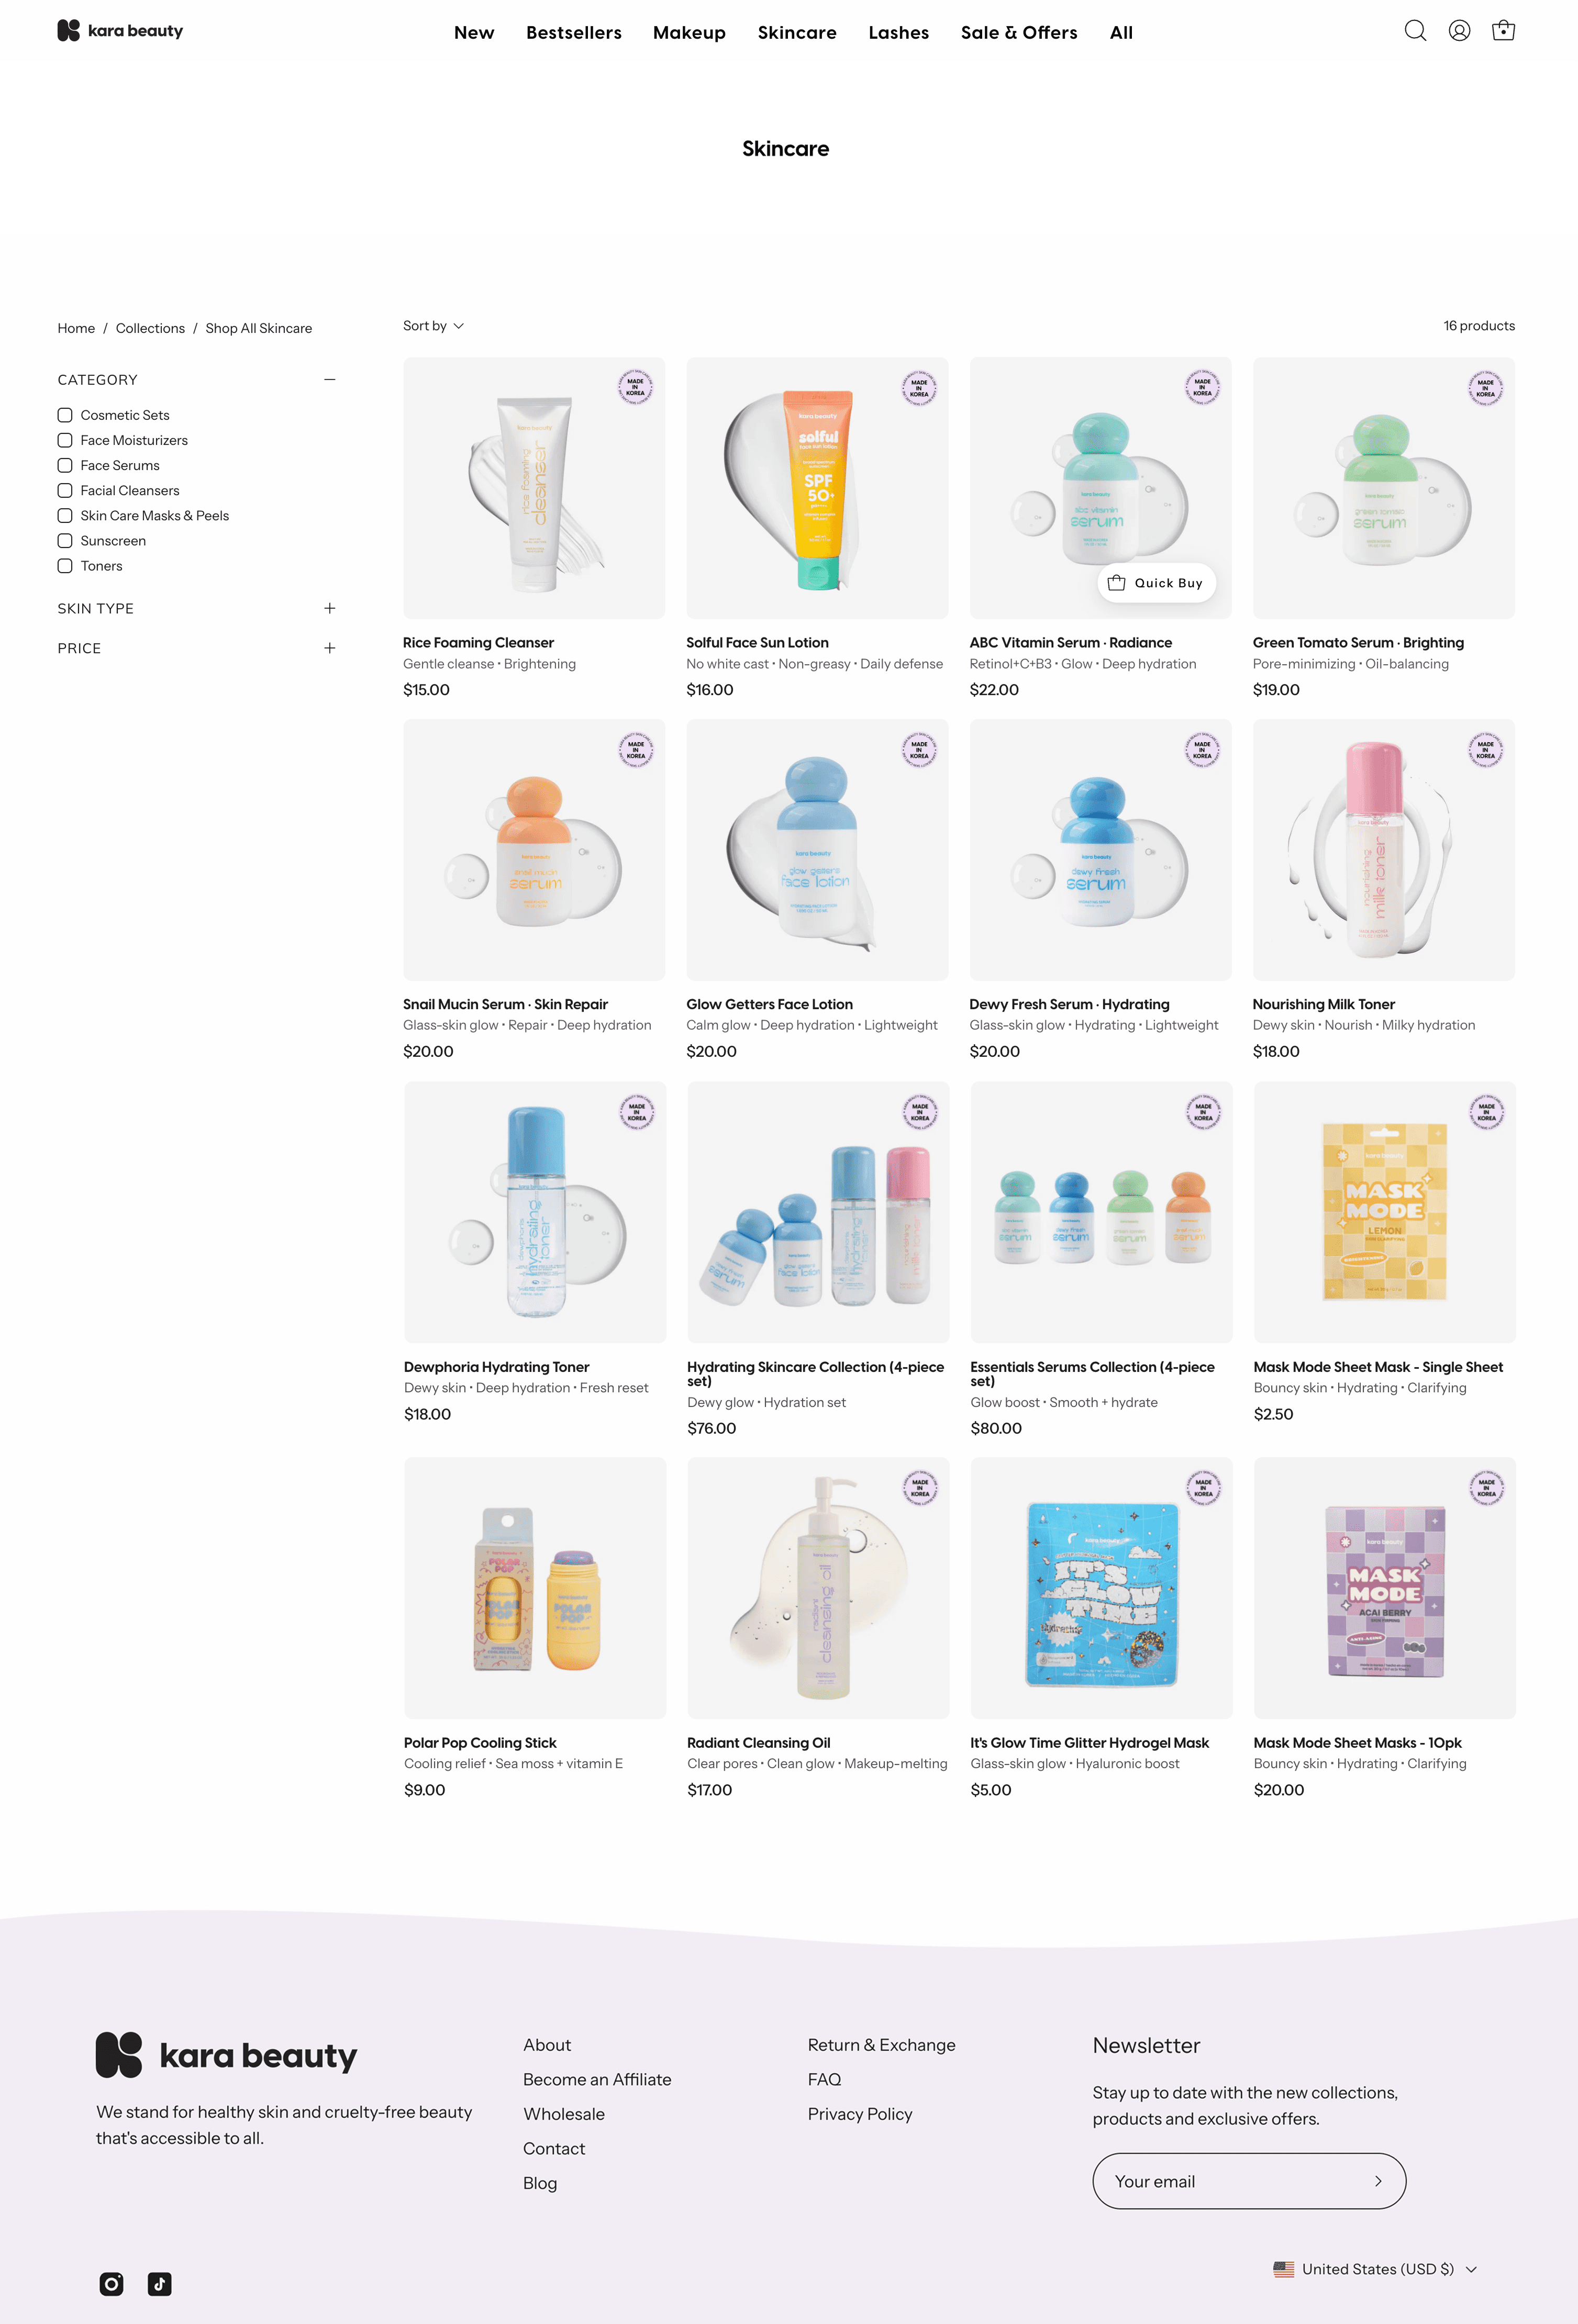
Evaluation - Product list page:
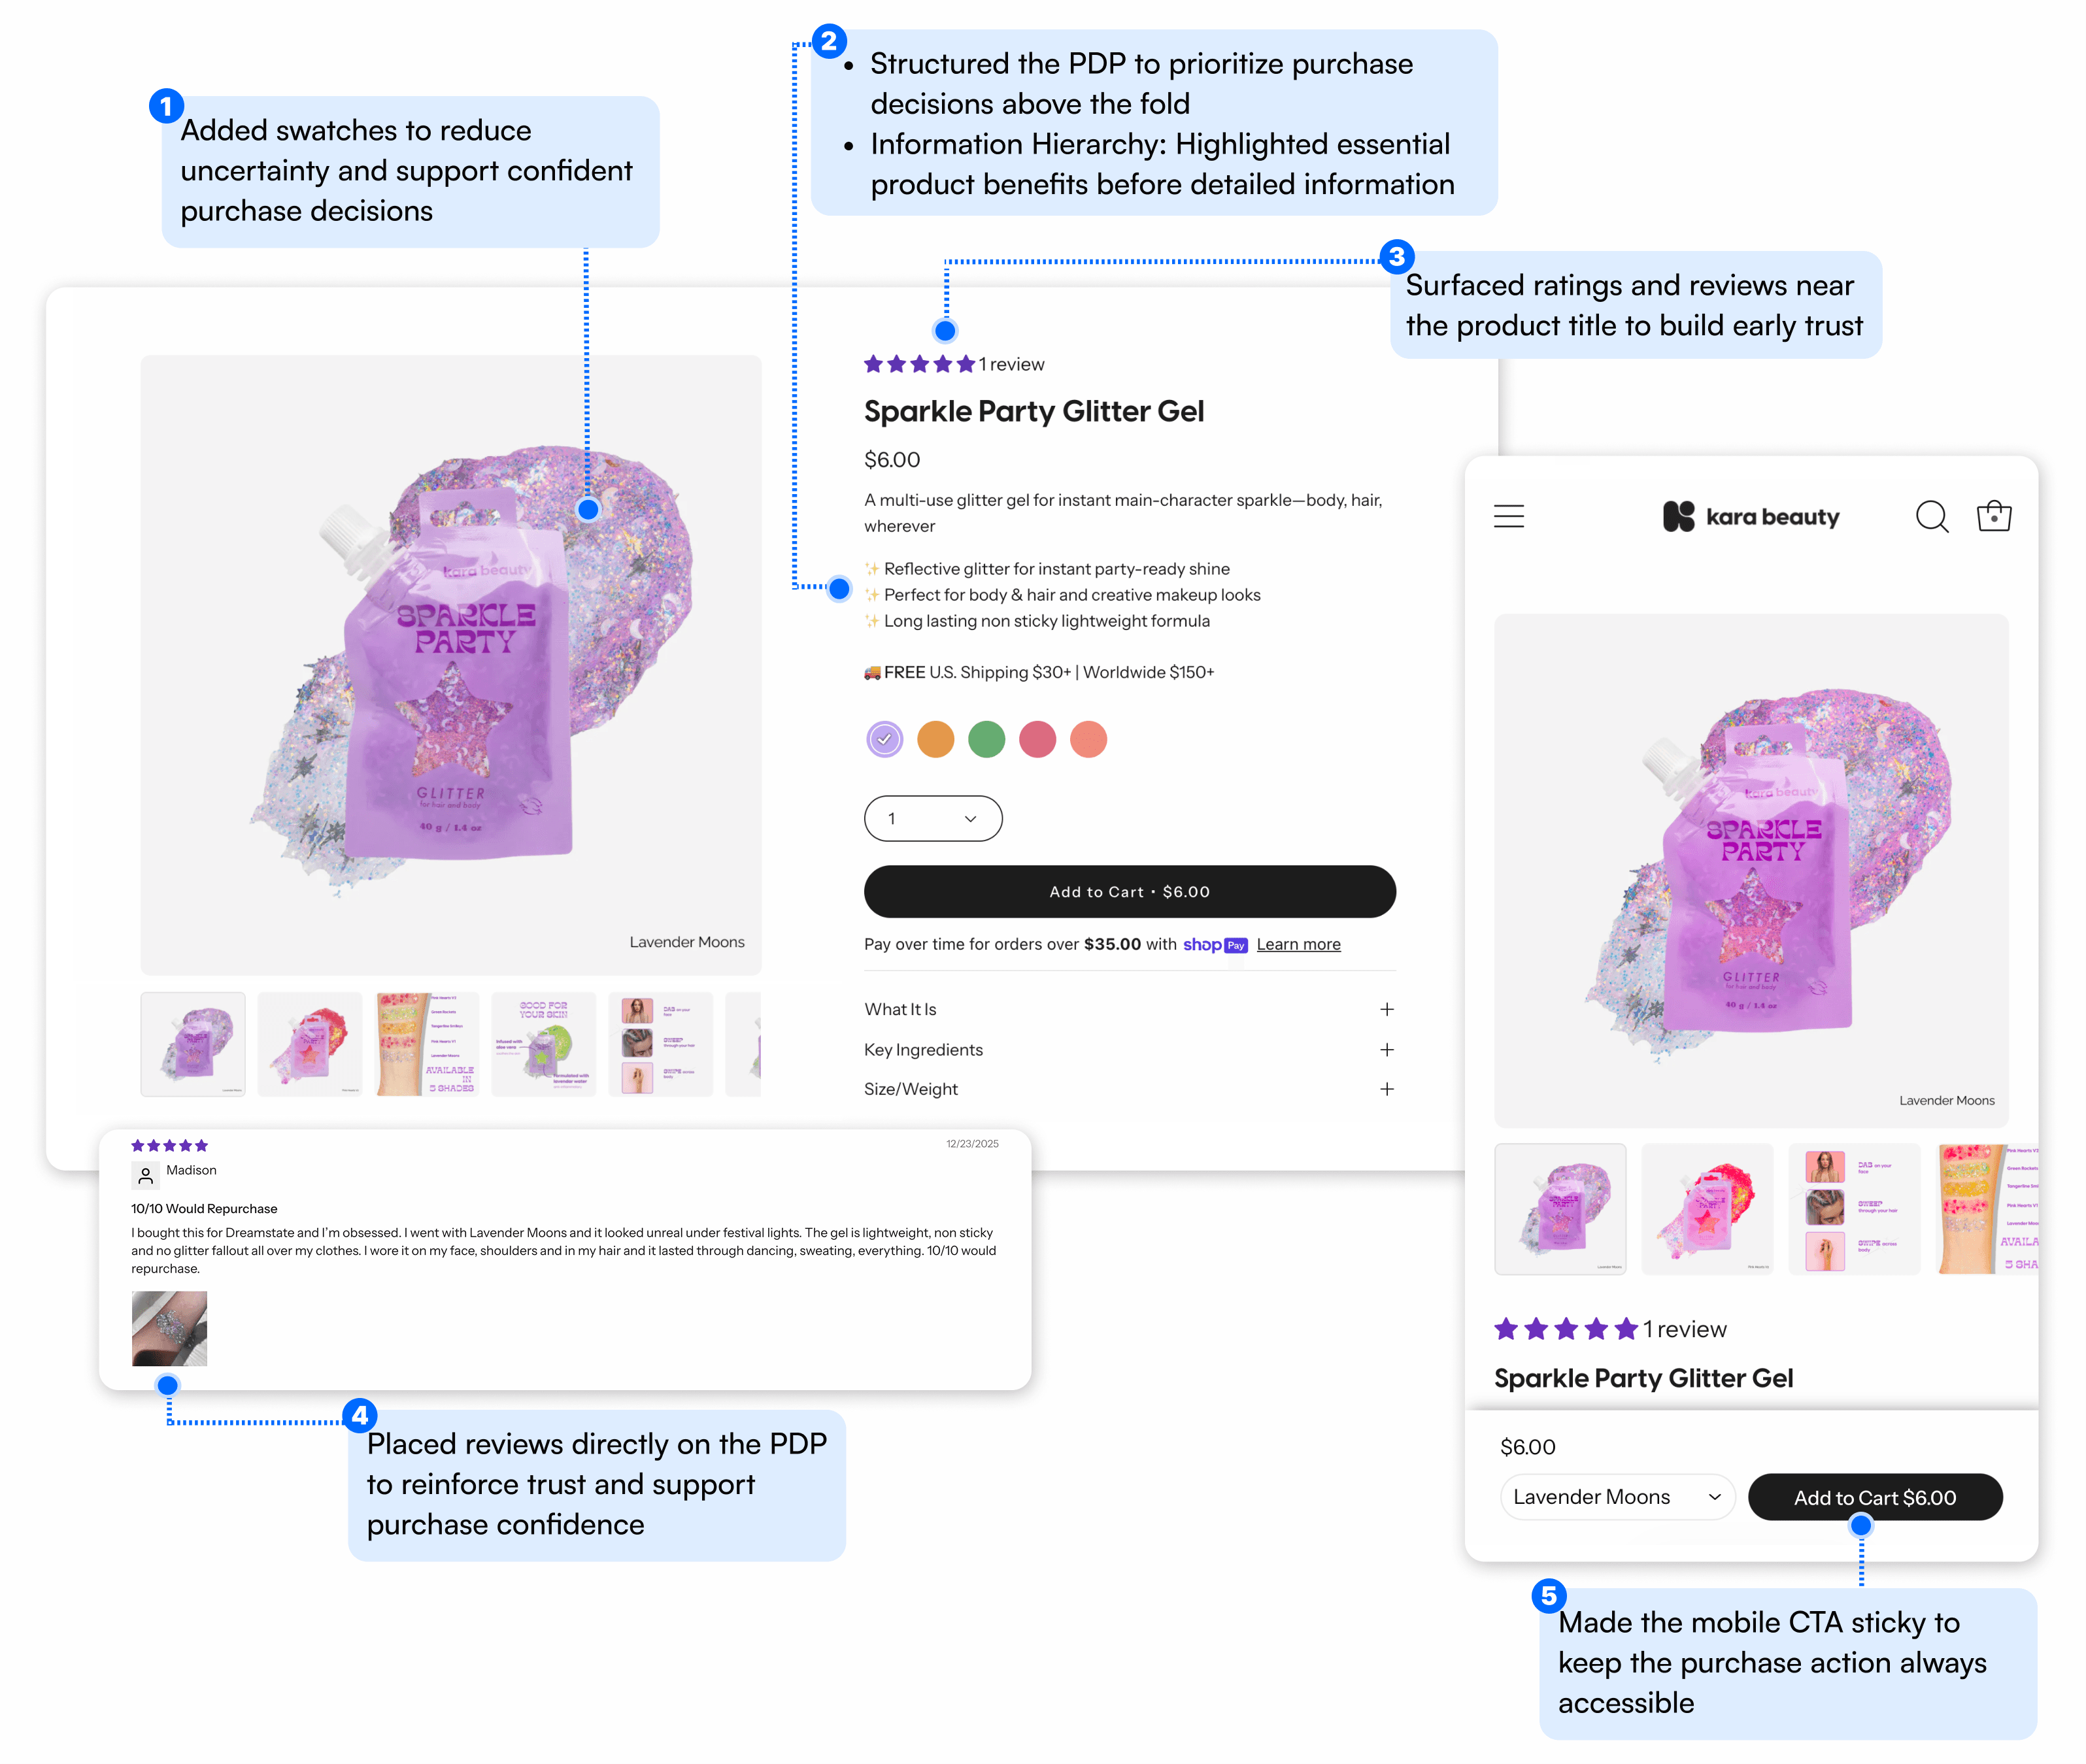
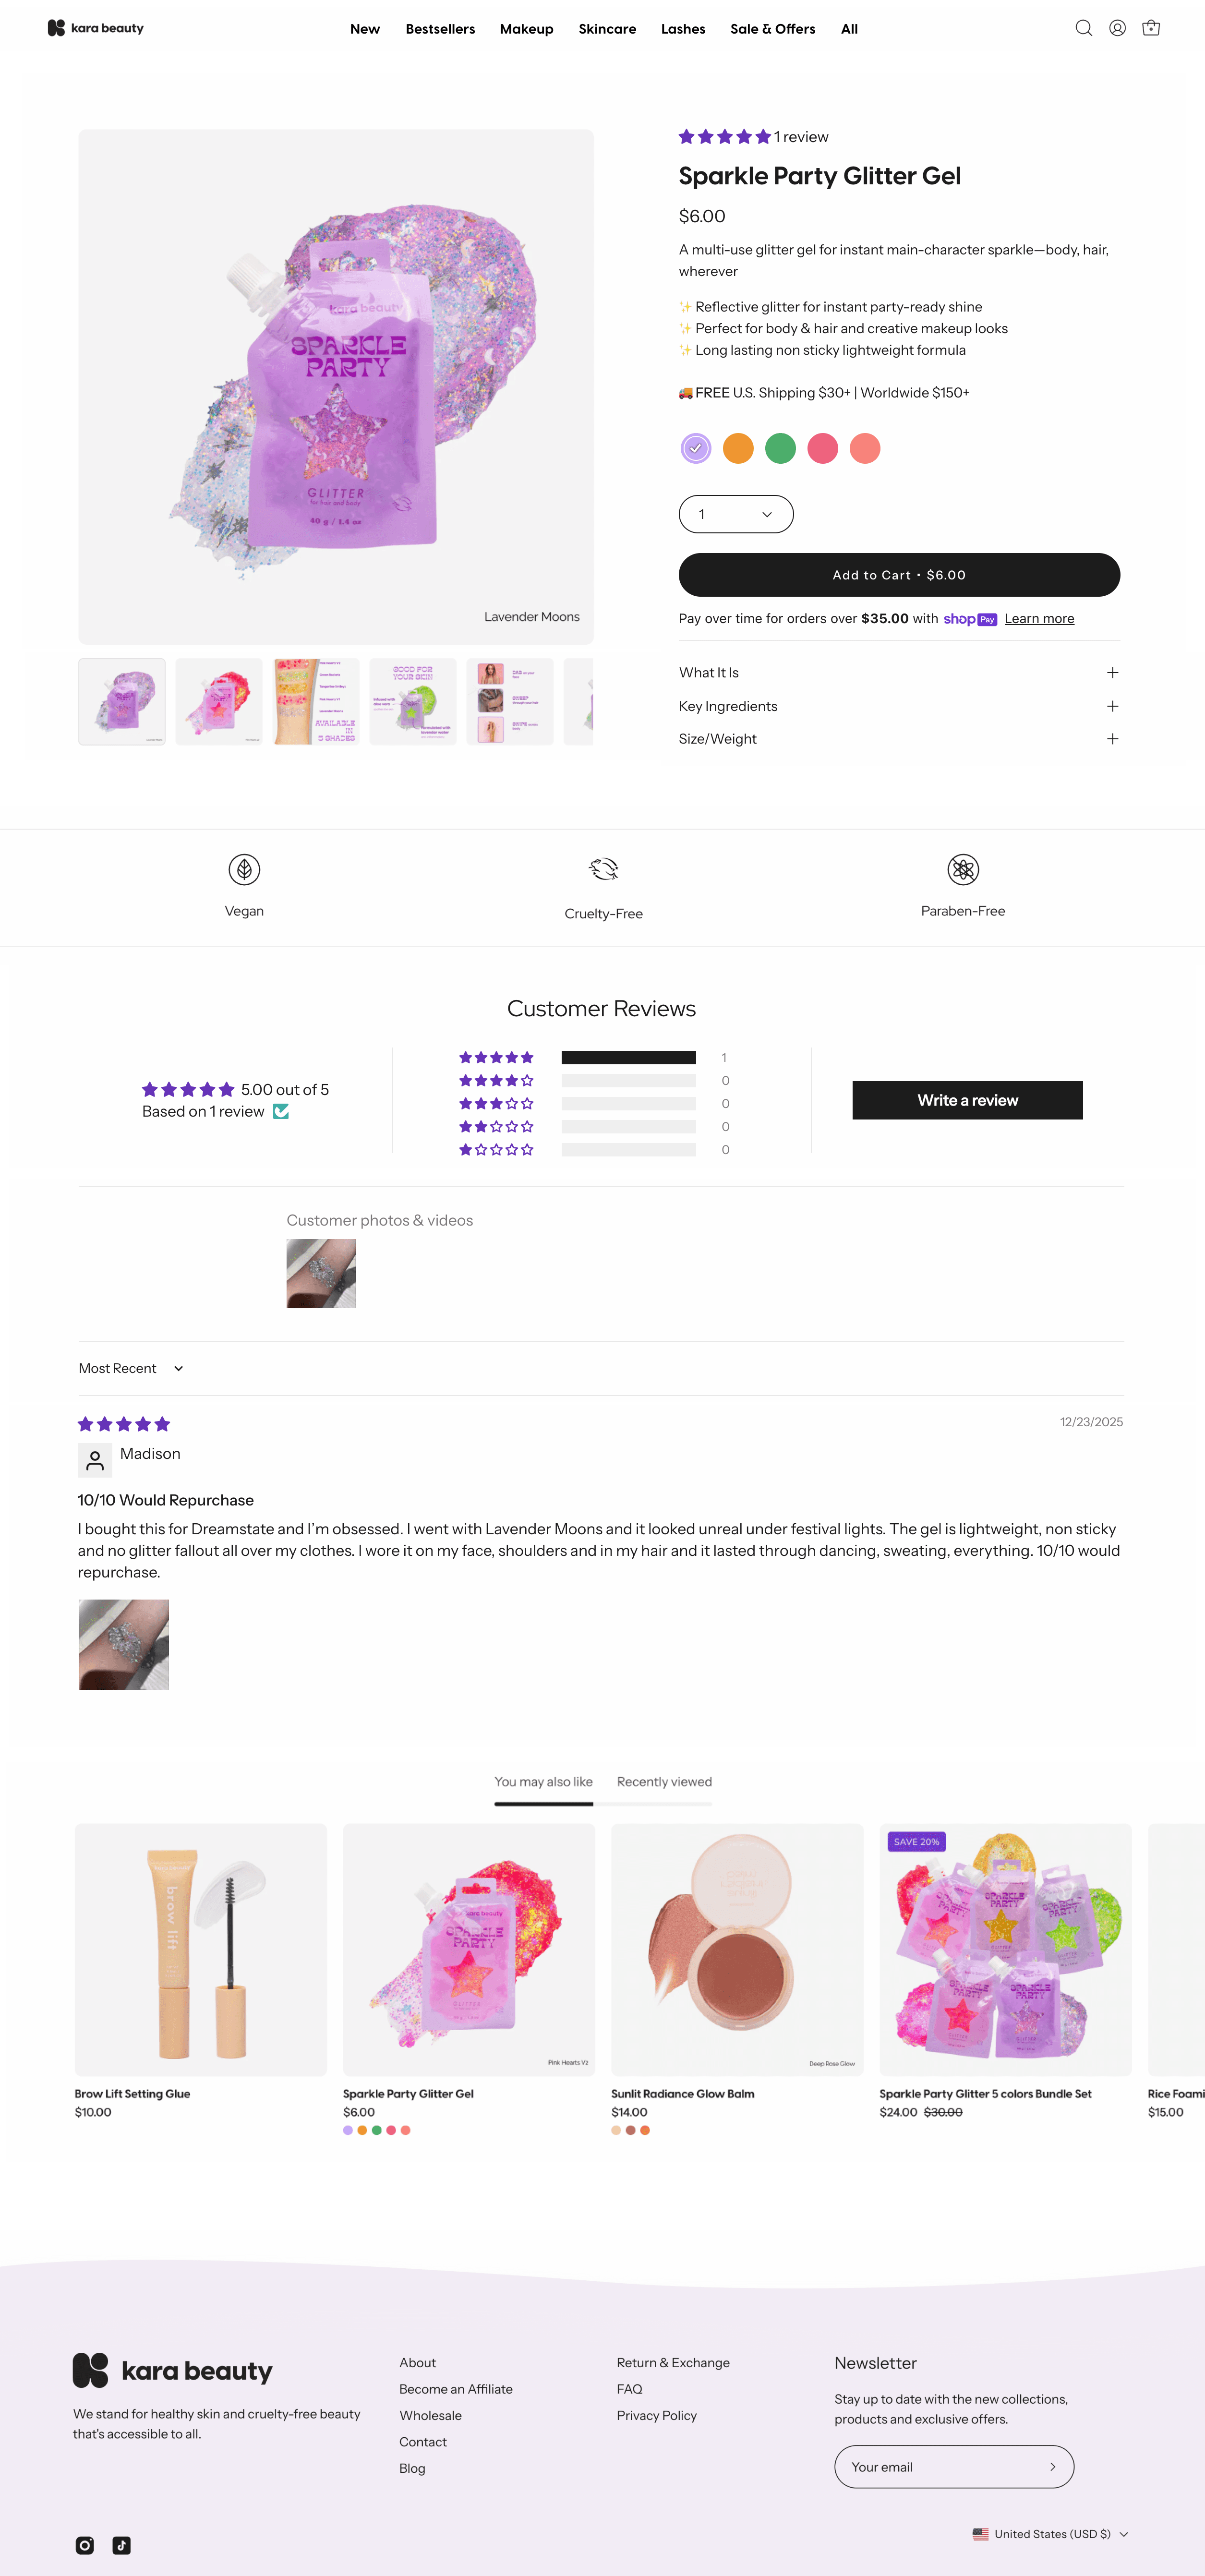
Decision - Product detail page:
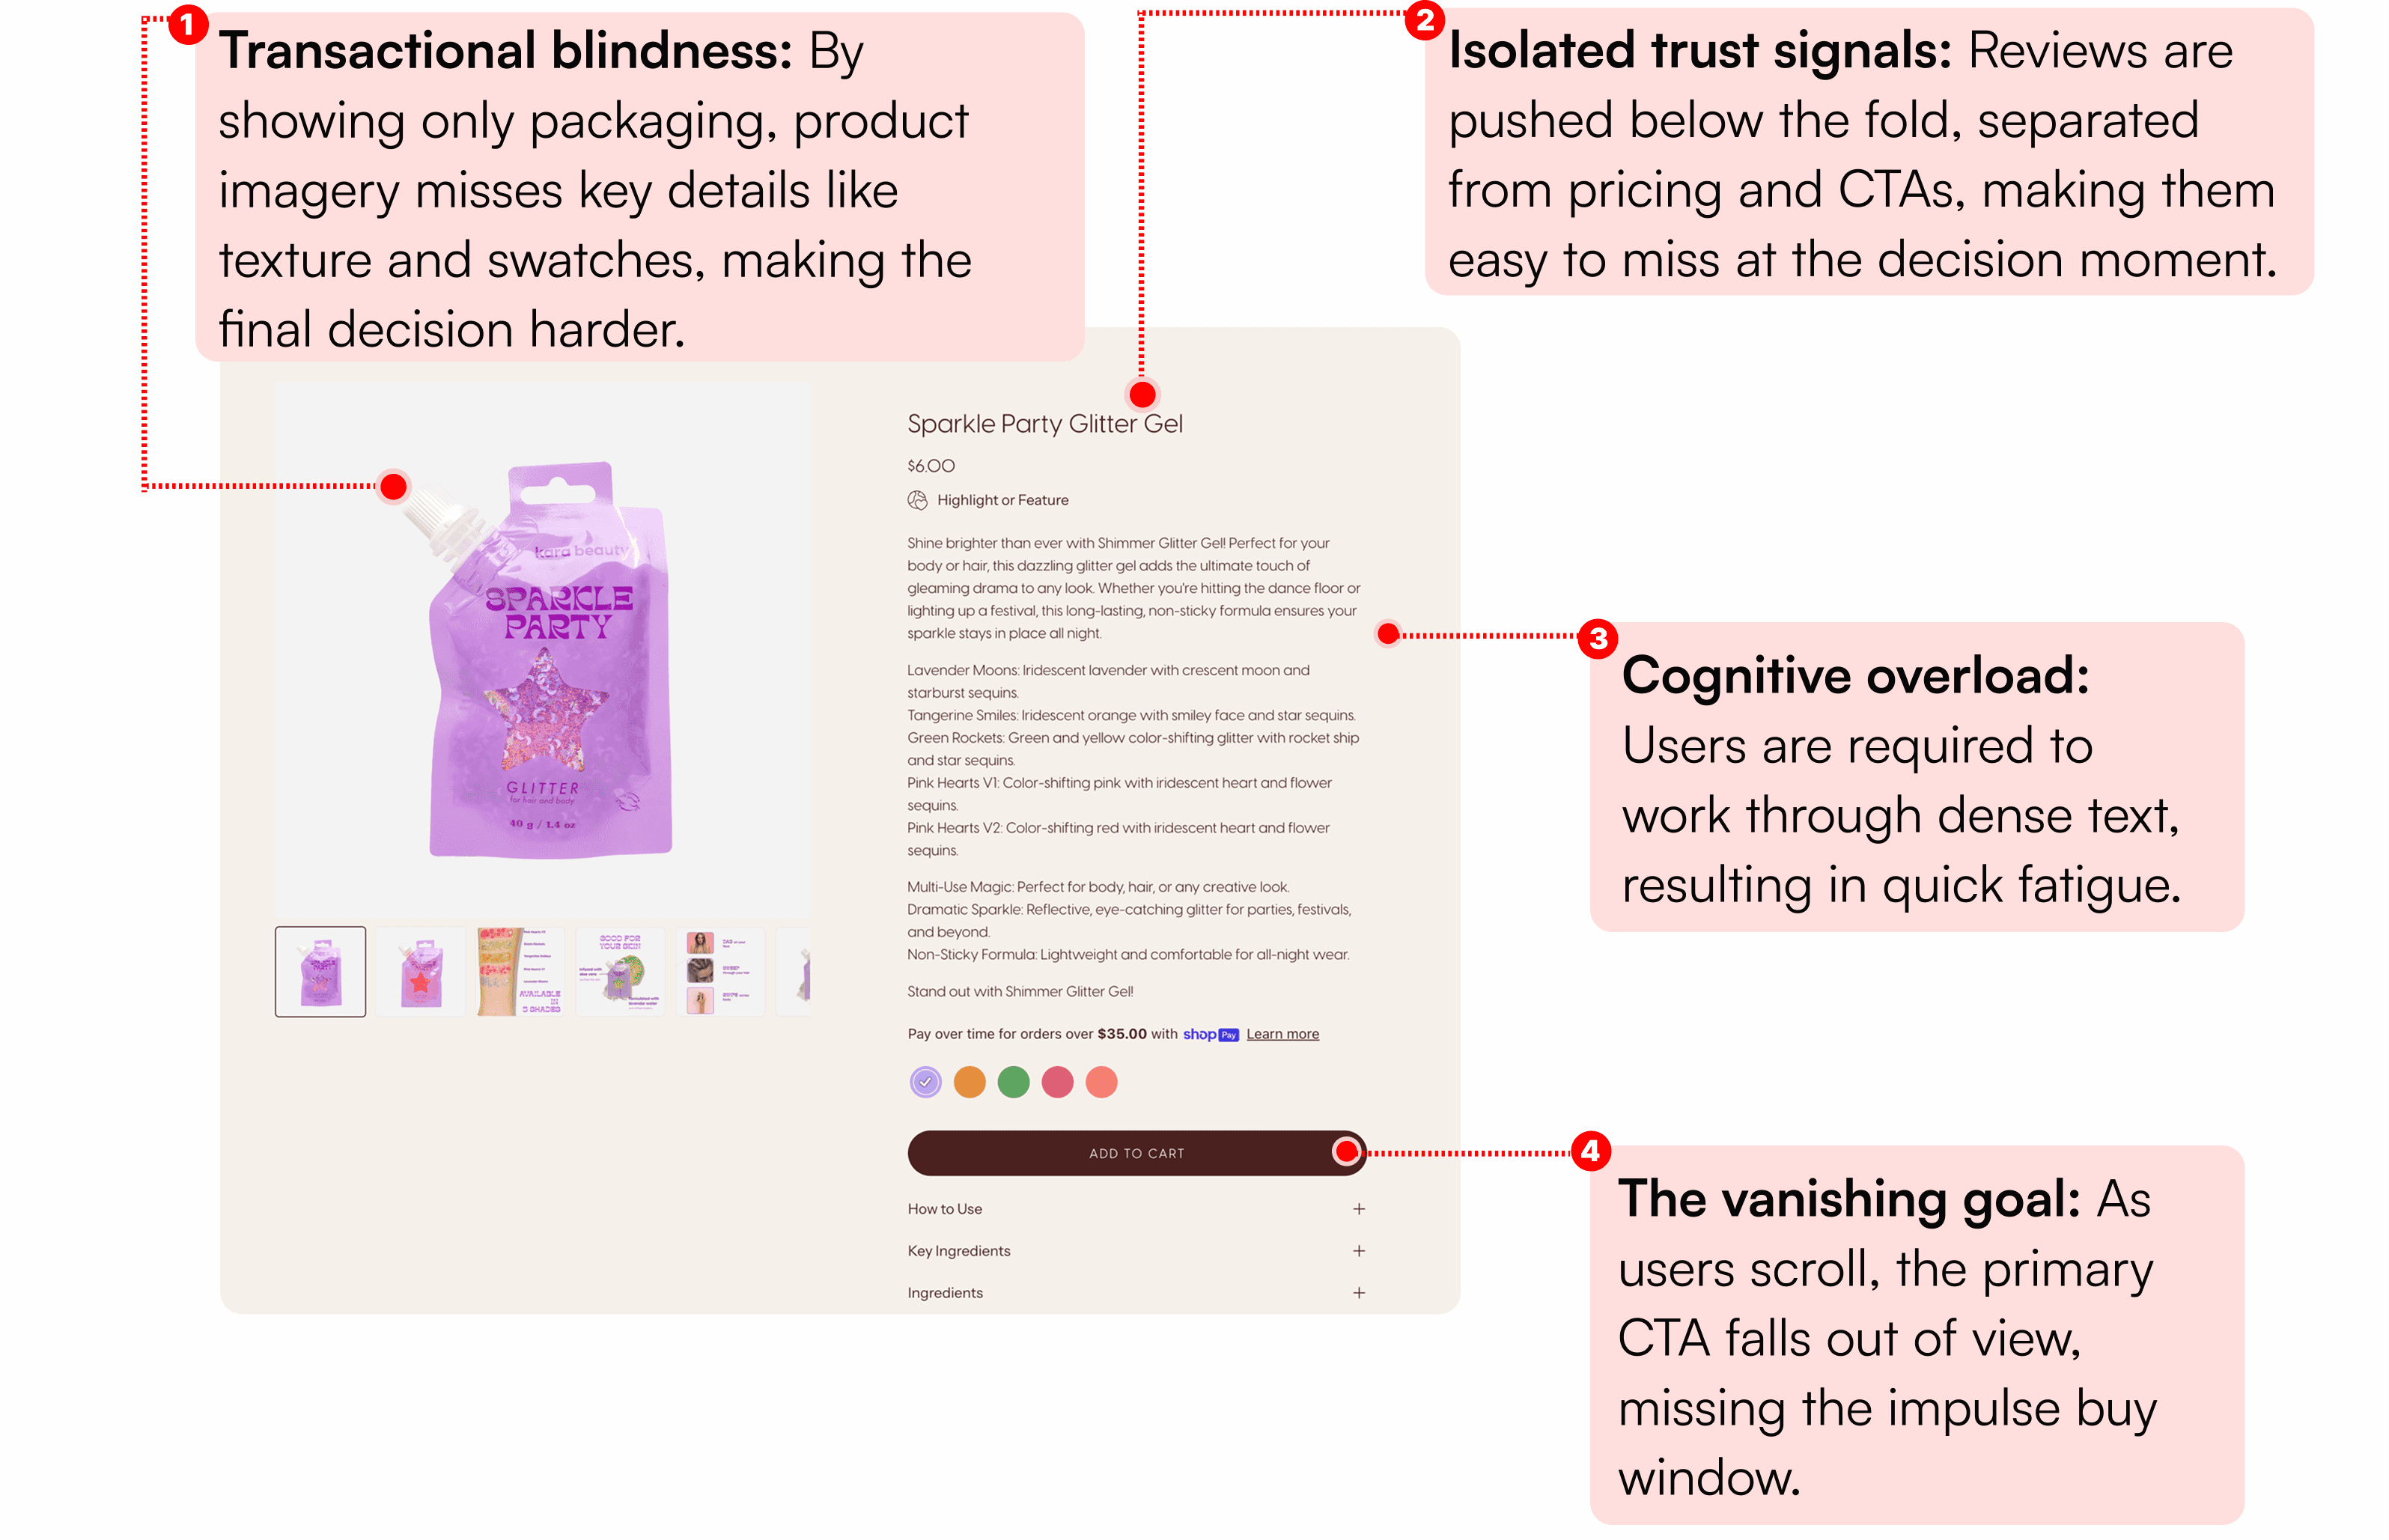
Three moments where shoppers were losing momentum
1. Discovery took too much effort: Shoppers couldn't tell where to start
2. Evaluation was harder than it needed to be: Comparing products meant opening every one
3. The decision moment lacked clarity: Key information and the primary action sat out of view
These pointed to three moments in the shopping journey that needed intervention.
PRODUCT STRATEGY
Three moments to improve
With 88% of sessions leaving without adding a product, I prioritized the three moments where the experience could most directly influence discovery, evaluation, and decision-making.

STRUCTURE & ITERATION
IA analysis
The audit found no Makeup category in the navigation, and first-time visitors had no New or Bestsellers cues to start from. I rebuilt the IA around what people were actually looking for, and flattened the depth so any category was reachable in one click.

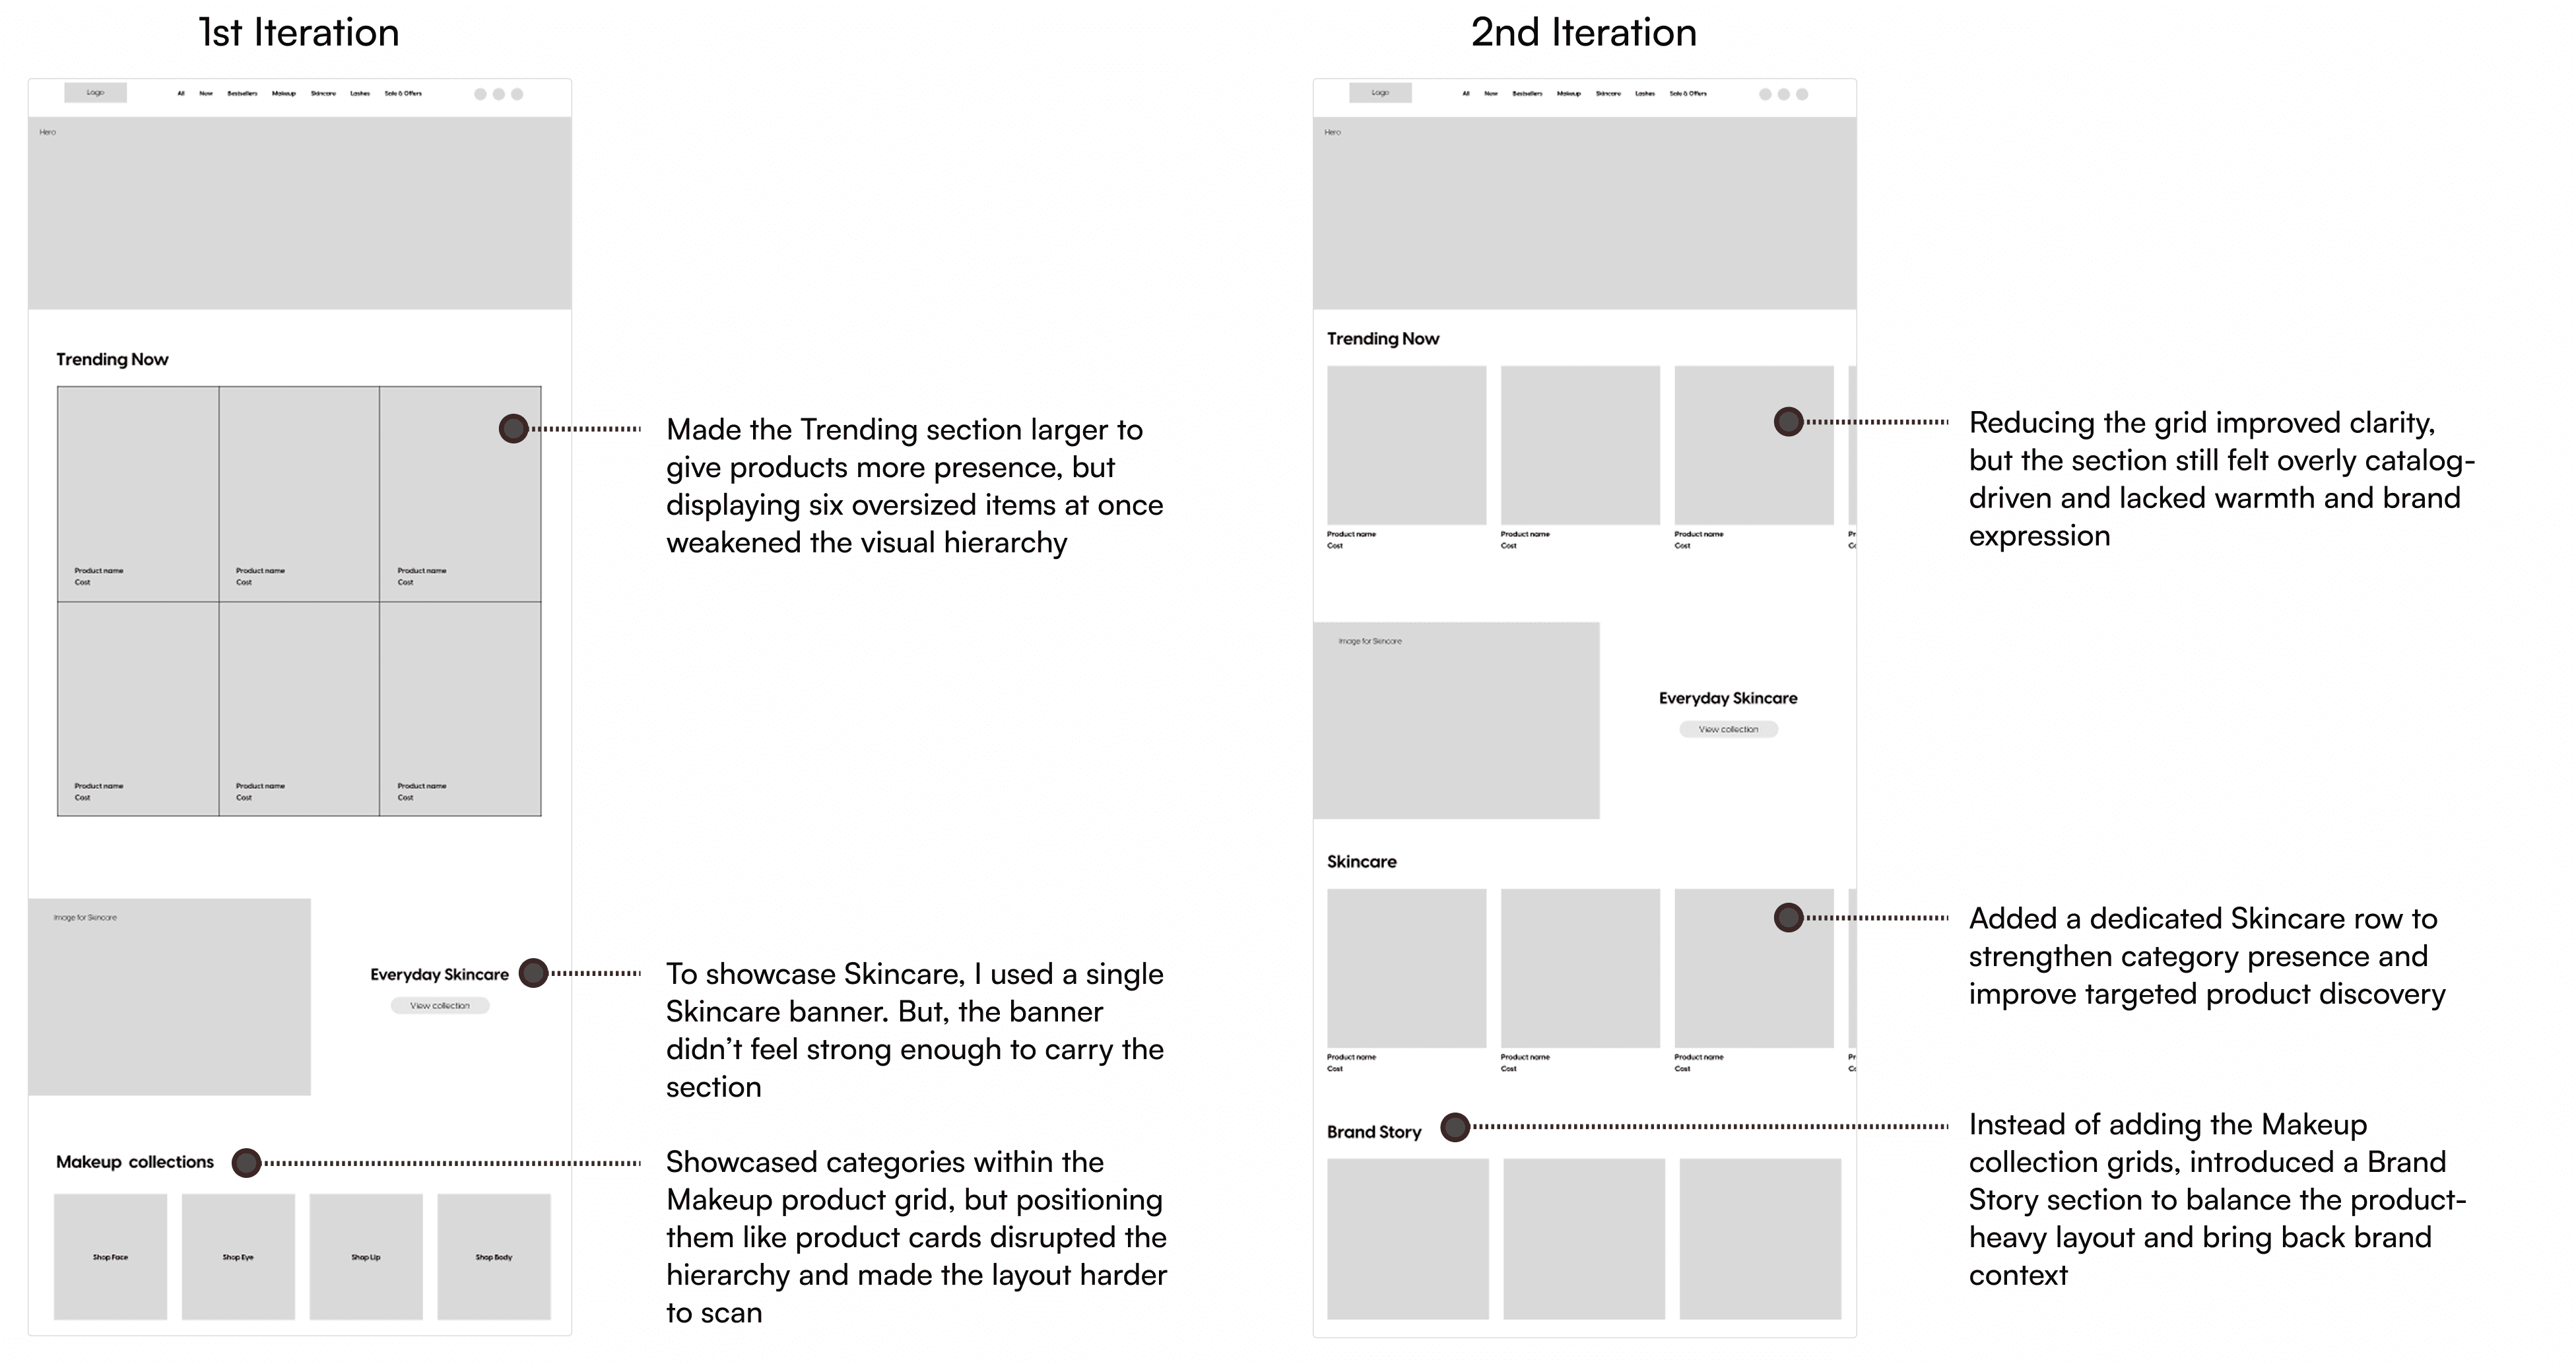
Iteration
Why it did not become the final version
Home
THE SOLUTION
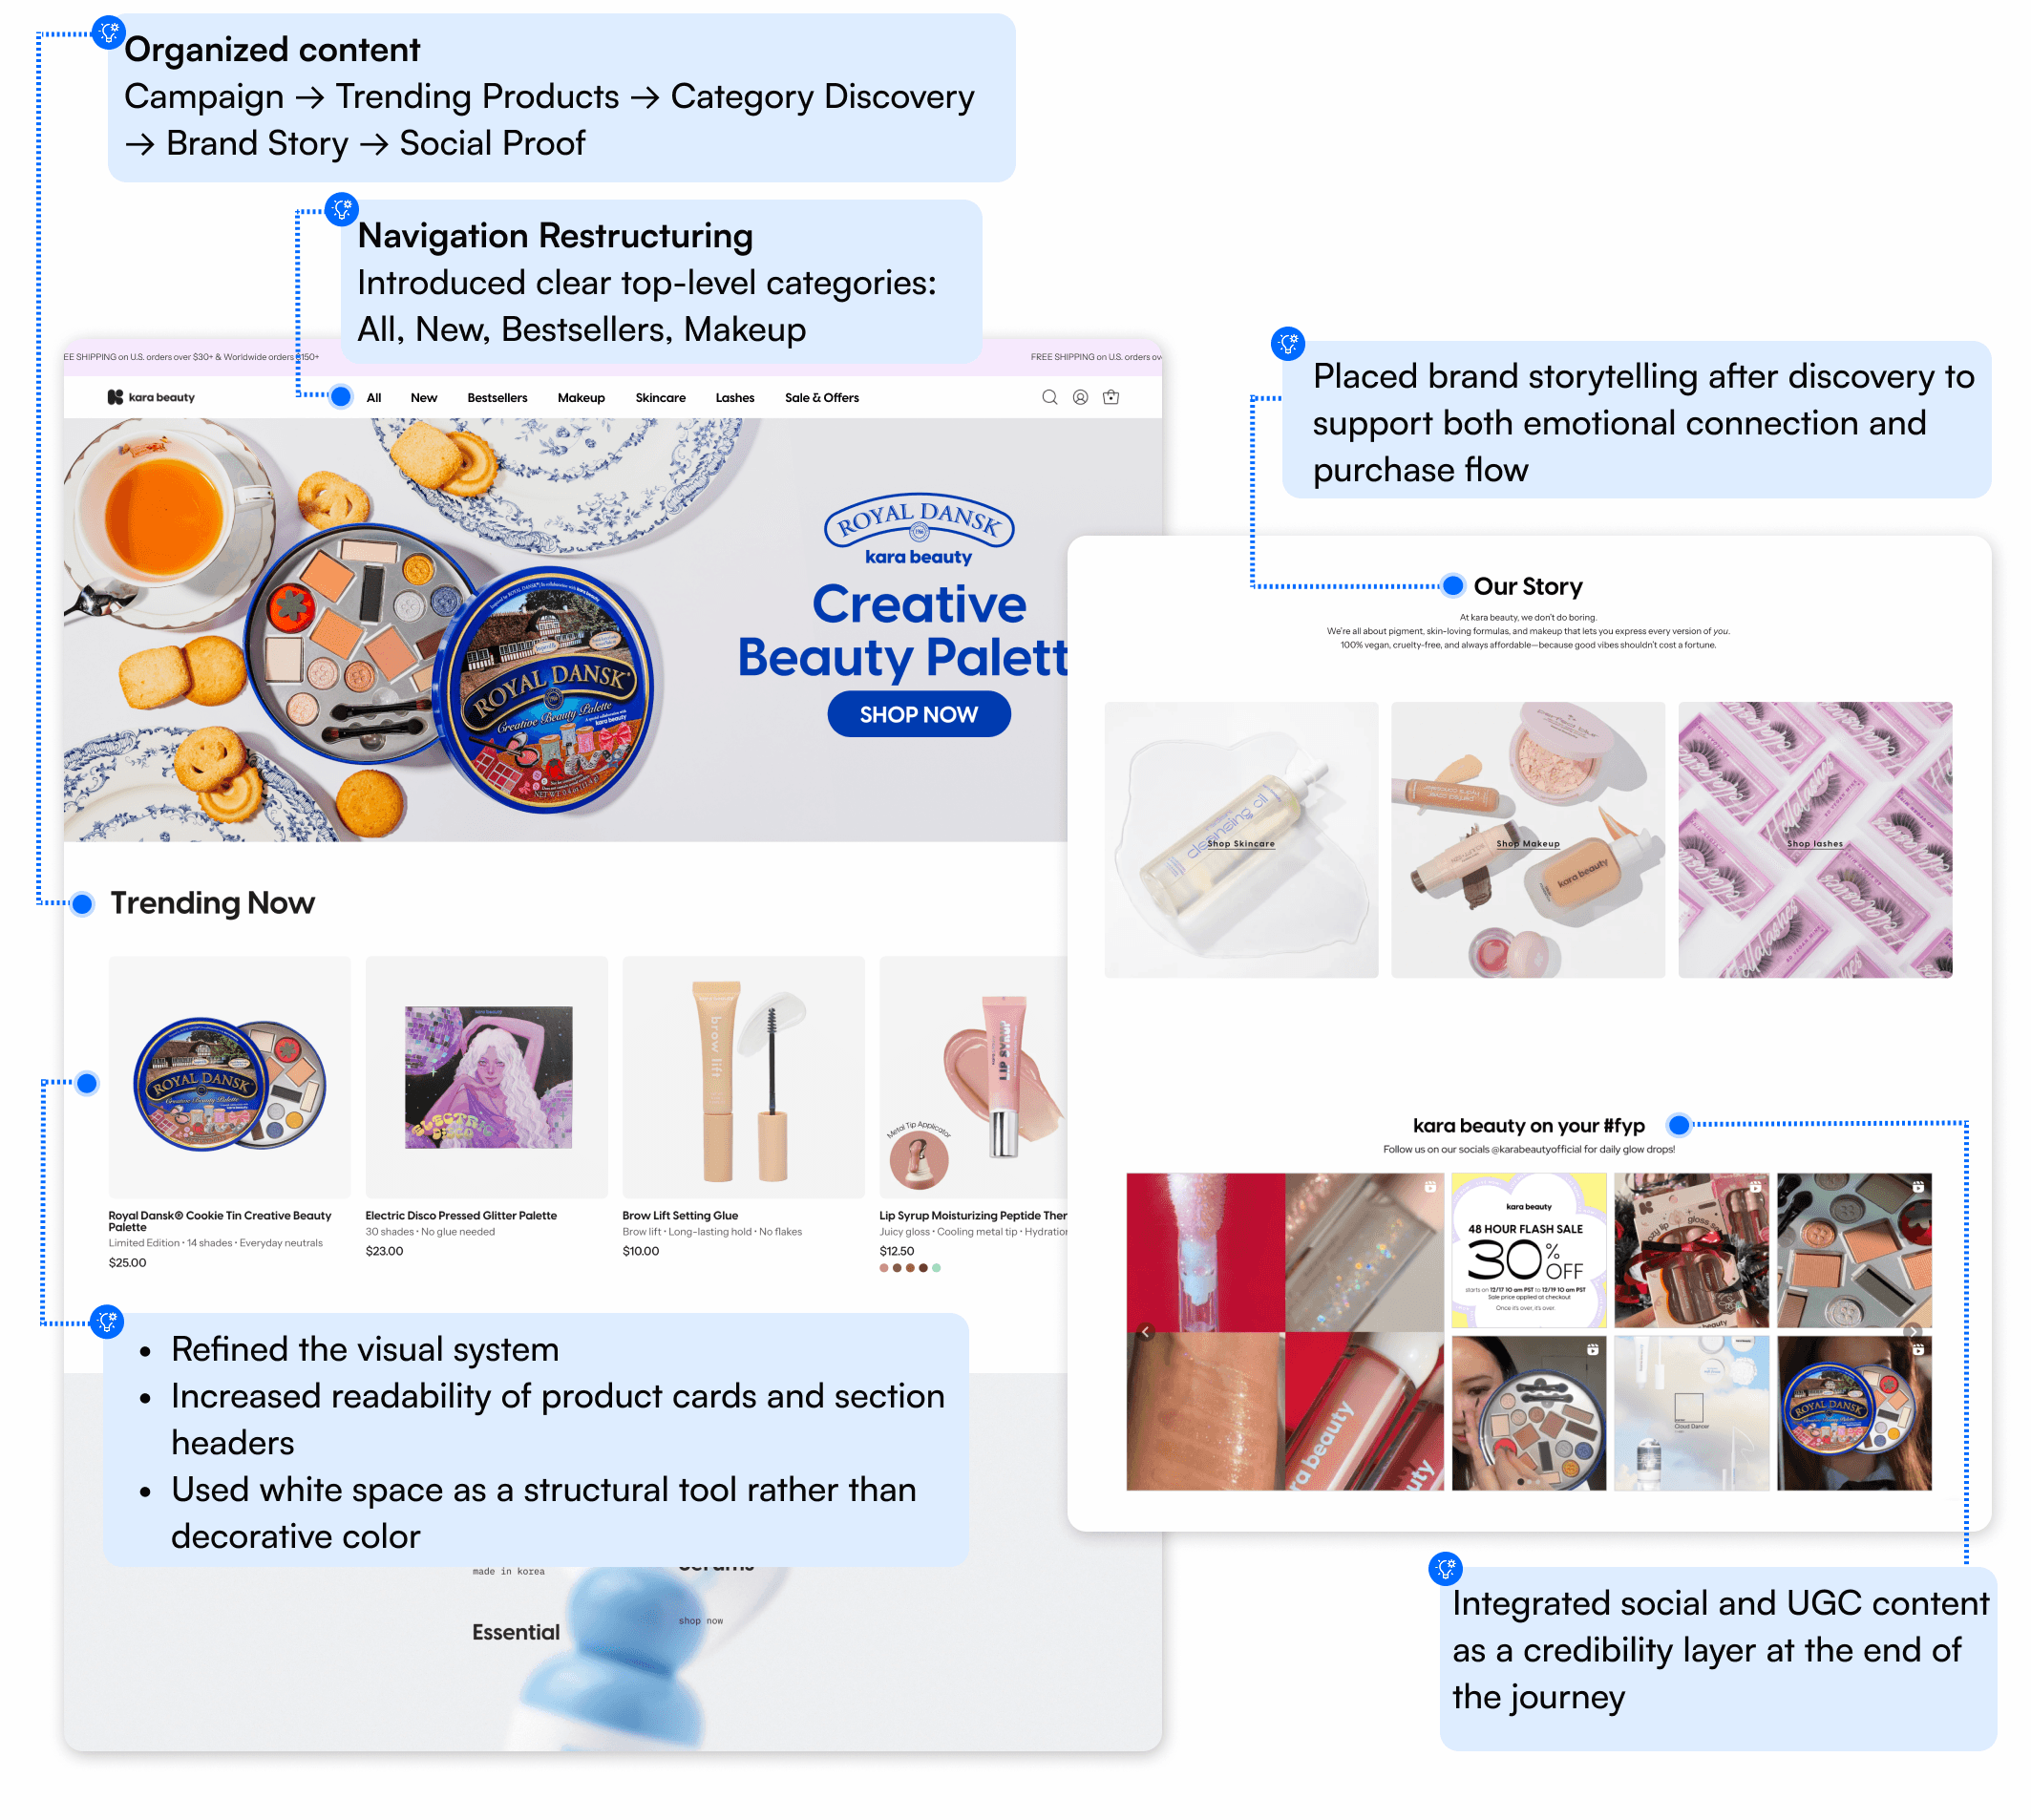
Discovery - Home page:
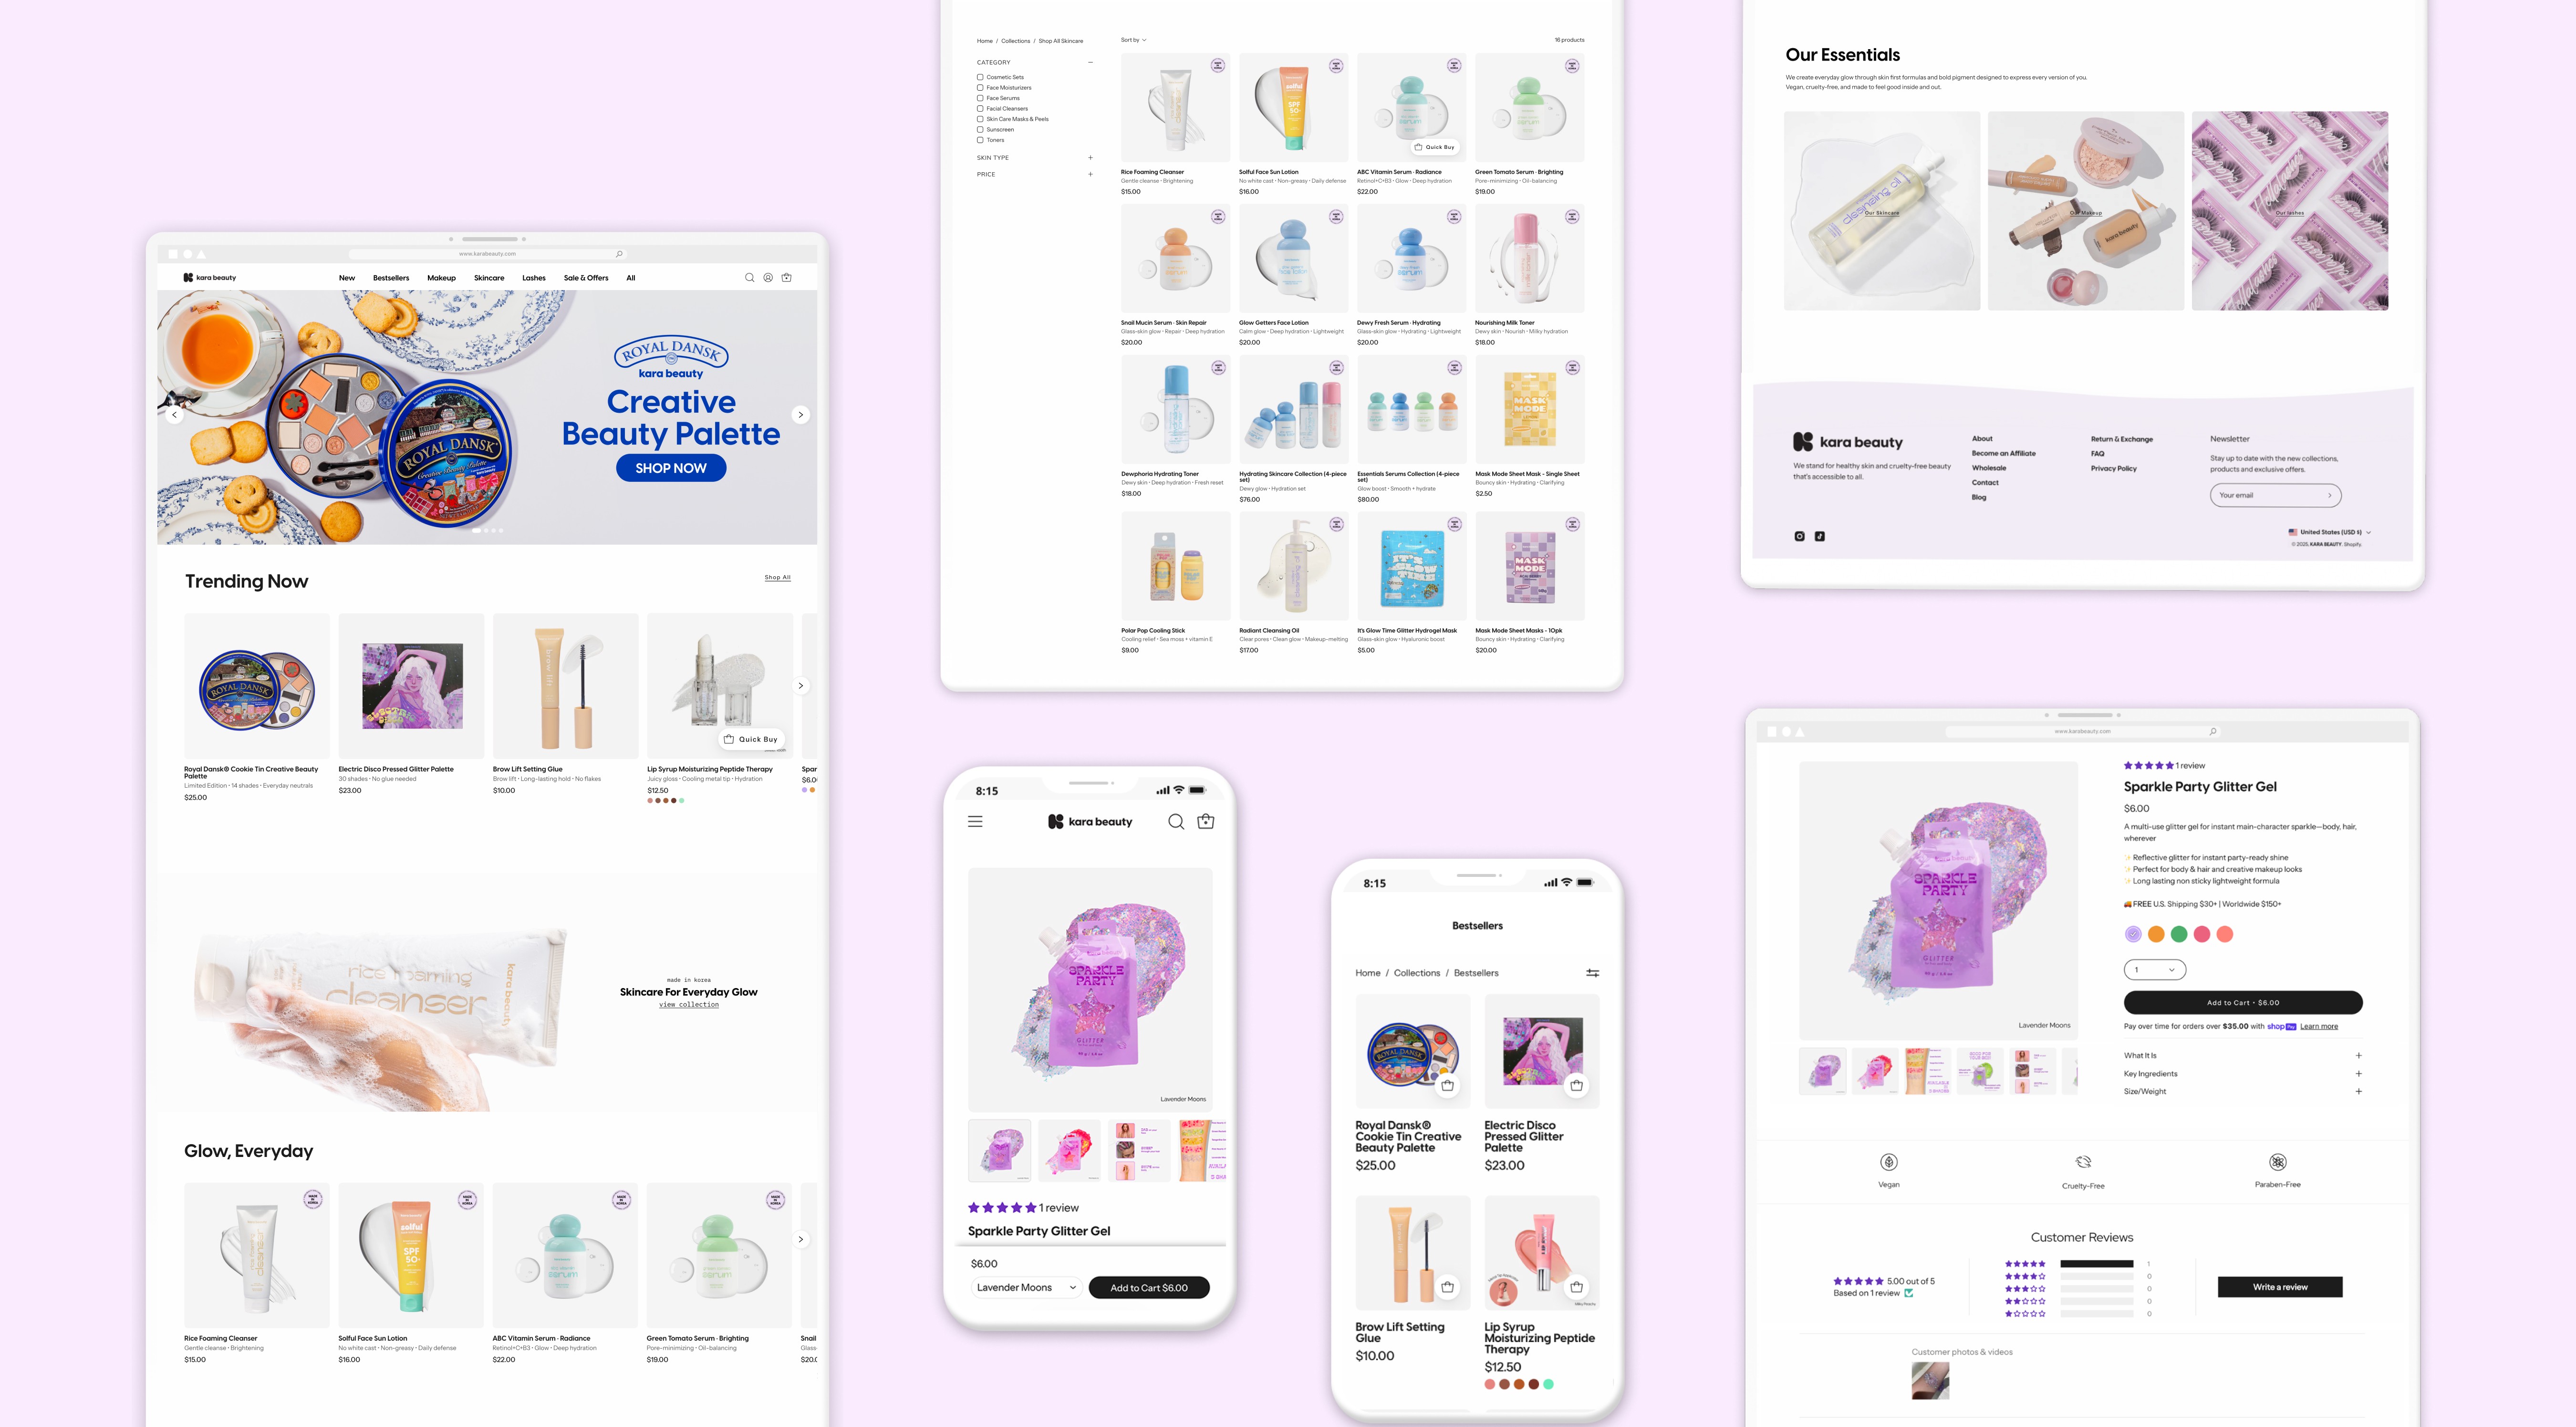
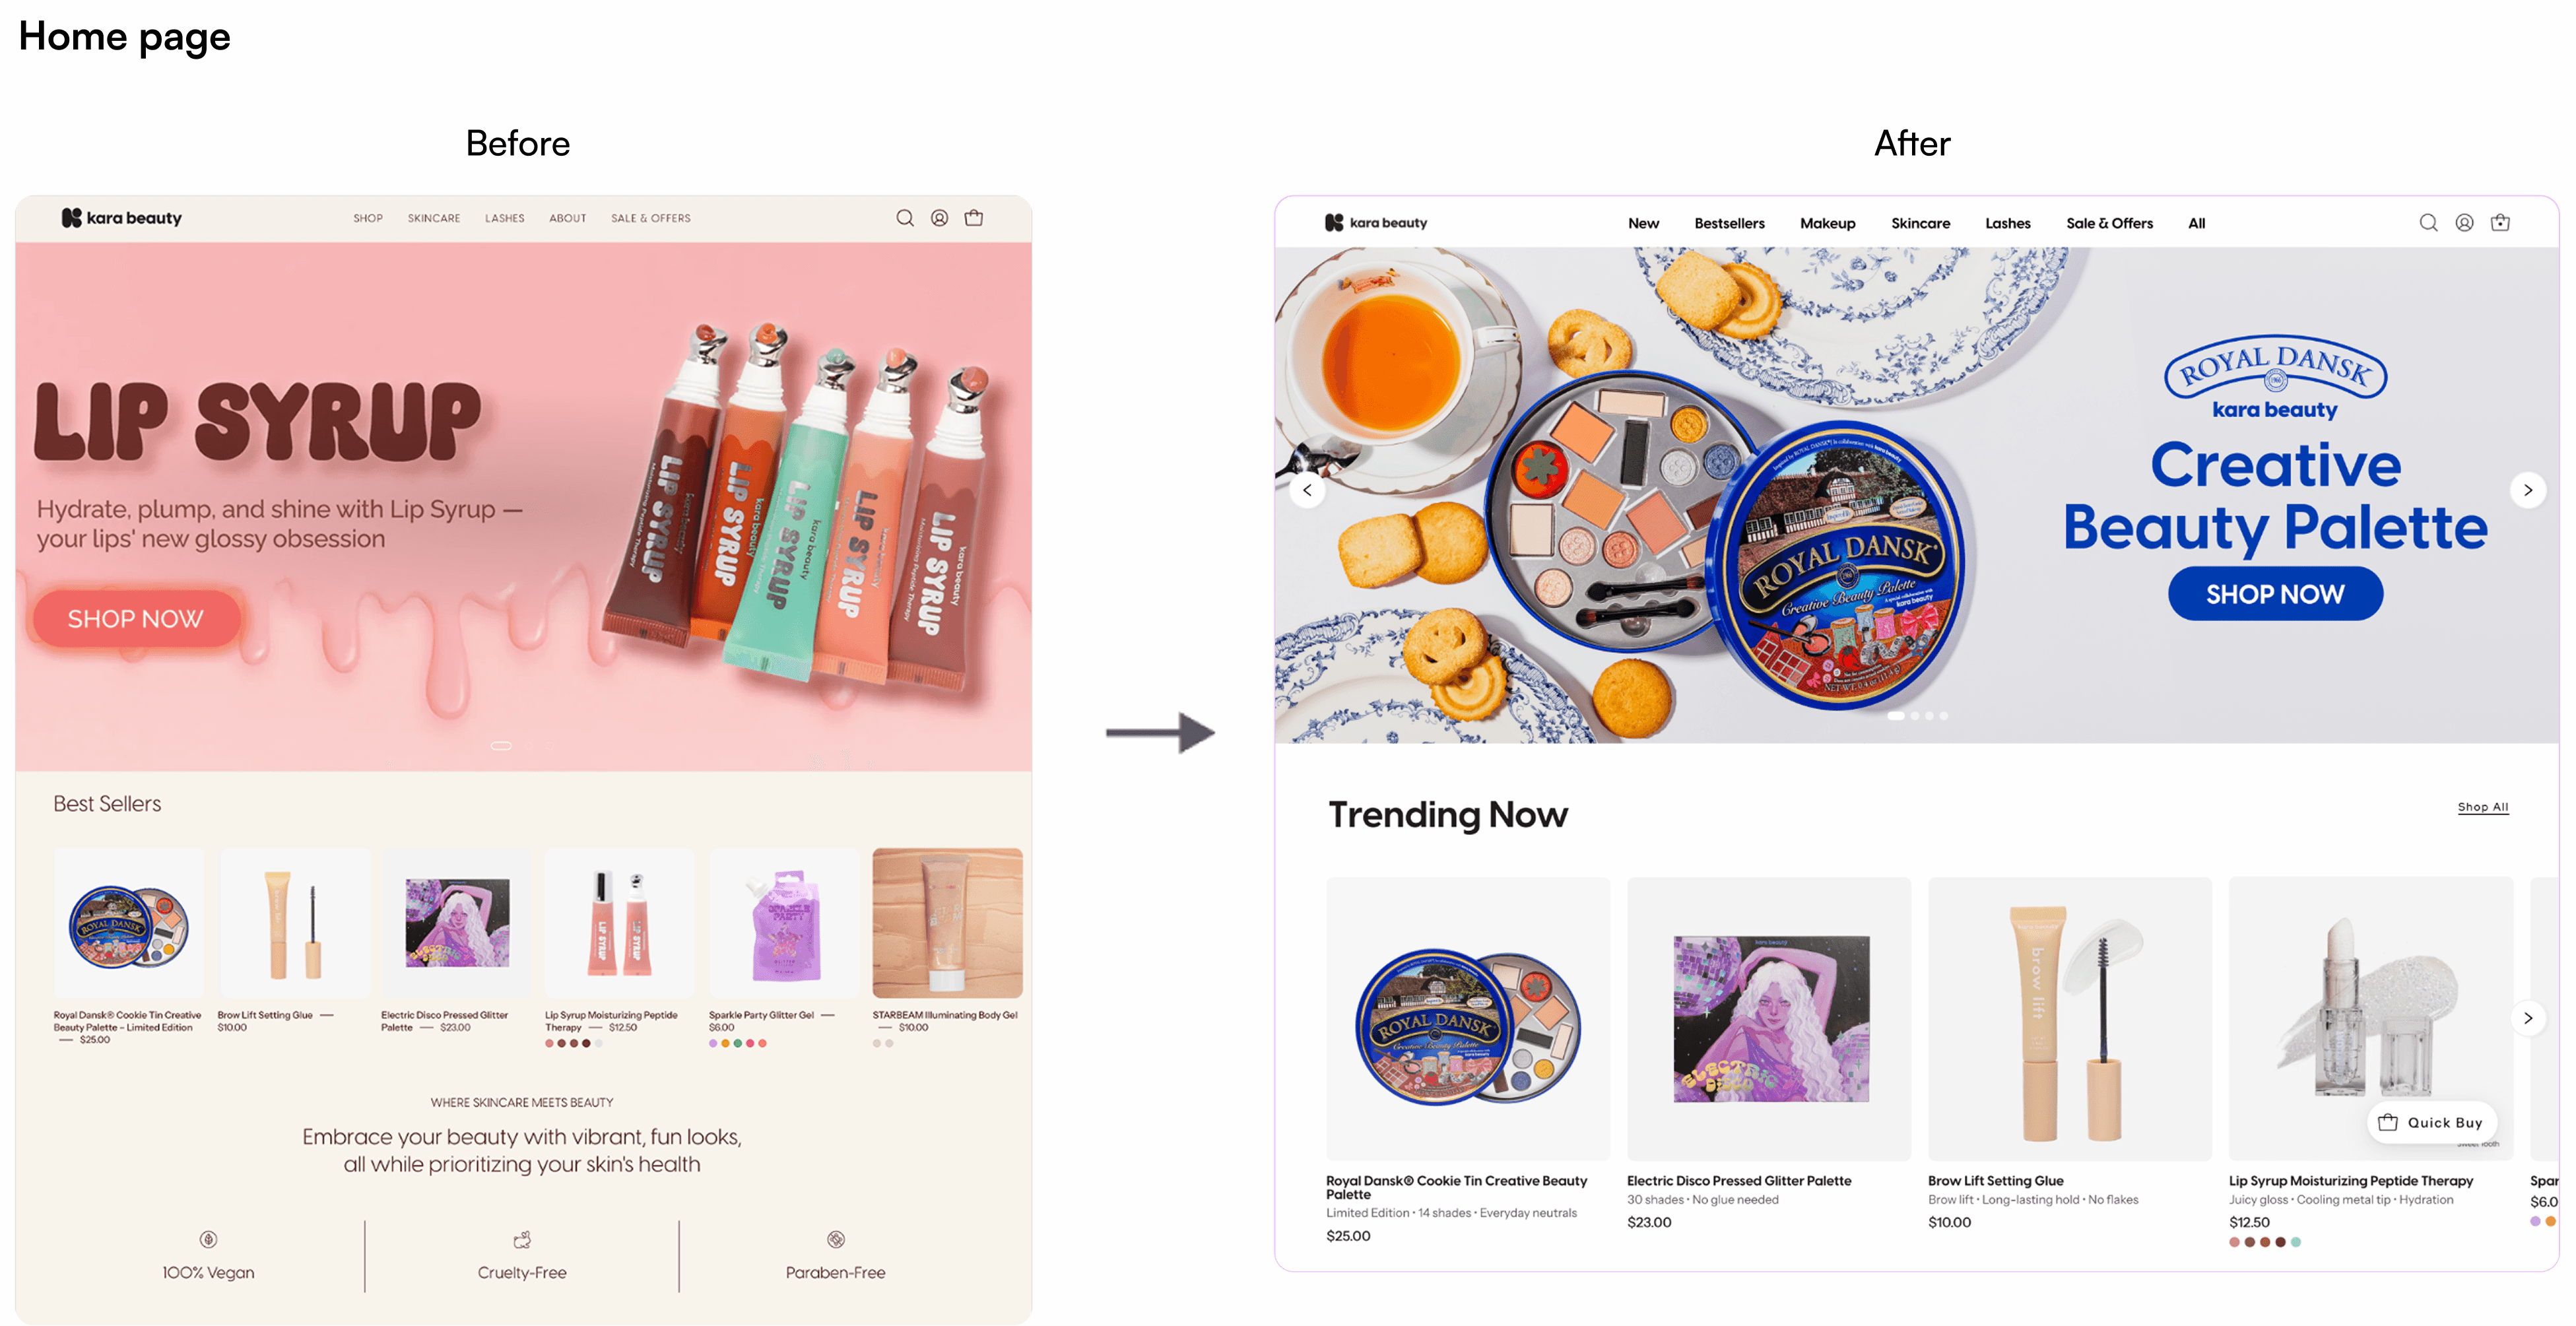
What this changes: The nav hid every category behind "SHOP", the Best Sellers grid gave no reason to care, and promotions cut into browsing. Categories now sit at the top level, cards carry shade count and benefit, and the page runs discovery before brand story. Participants found where to start faster and backtracked less.


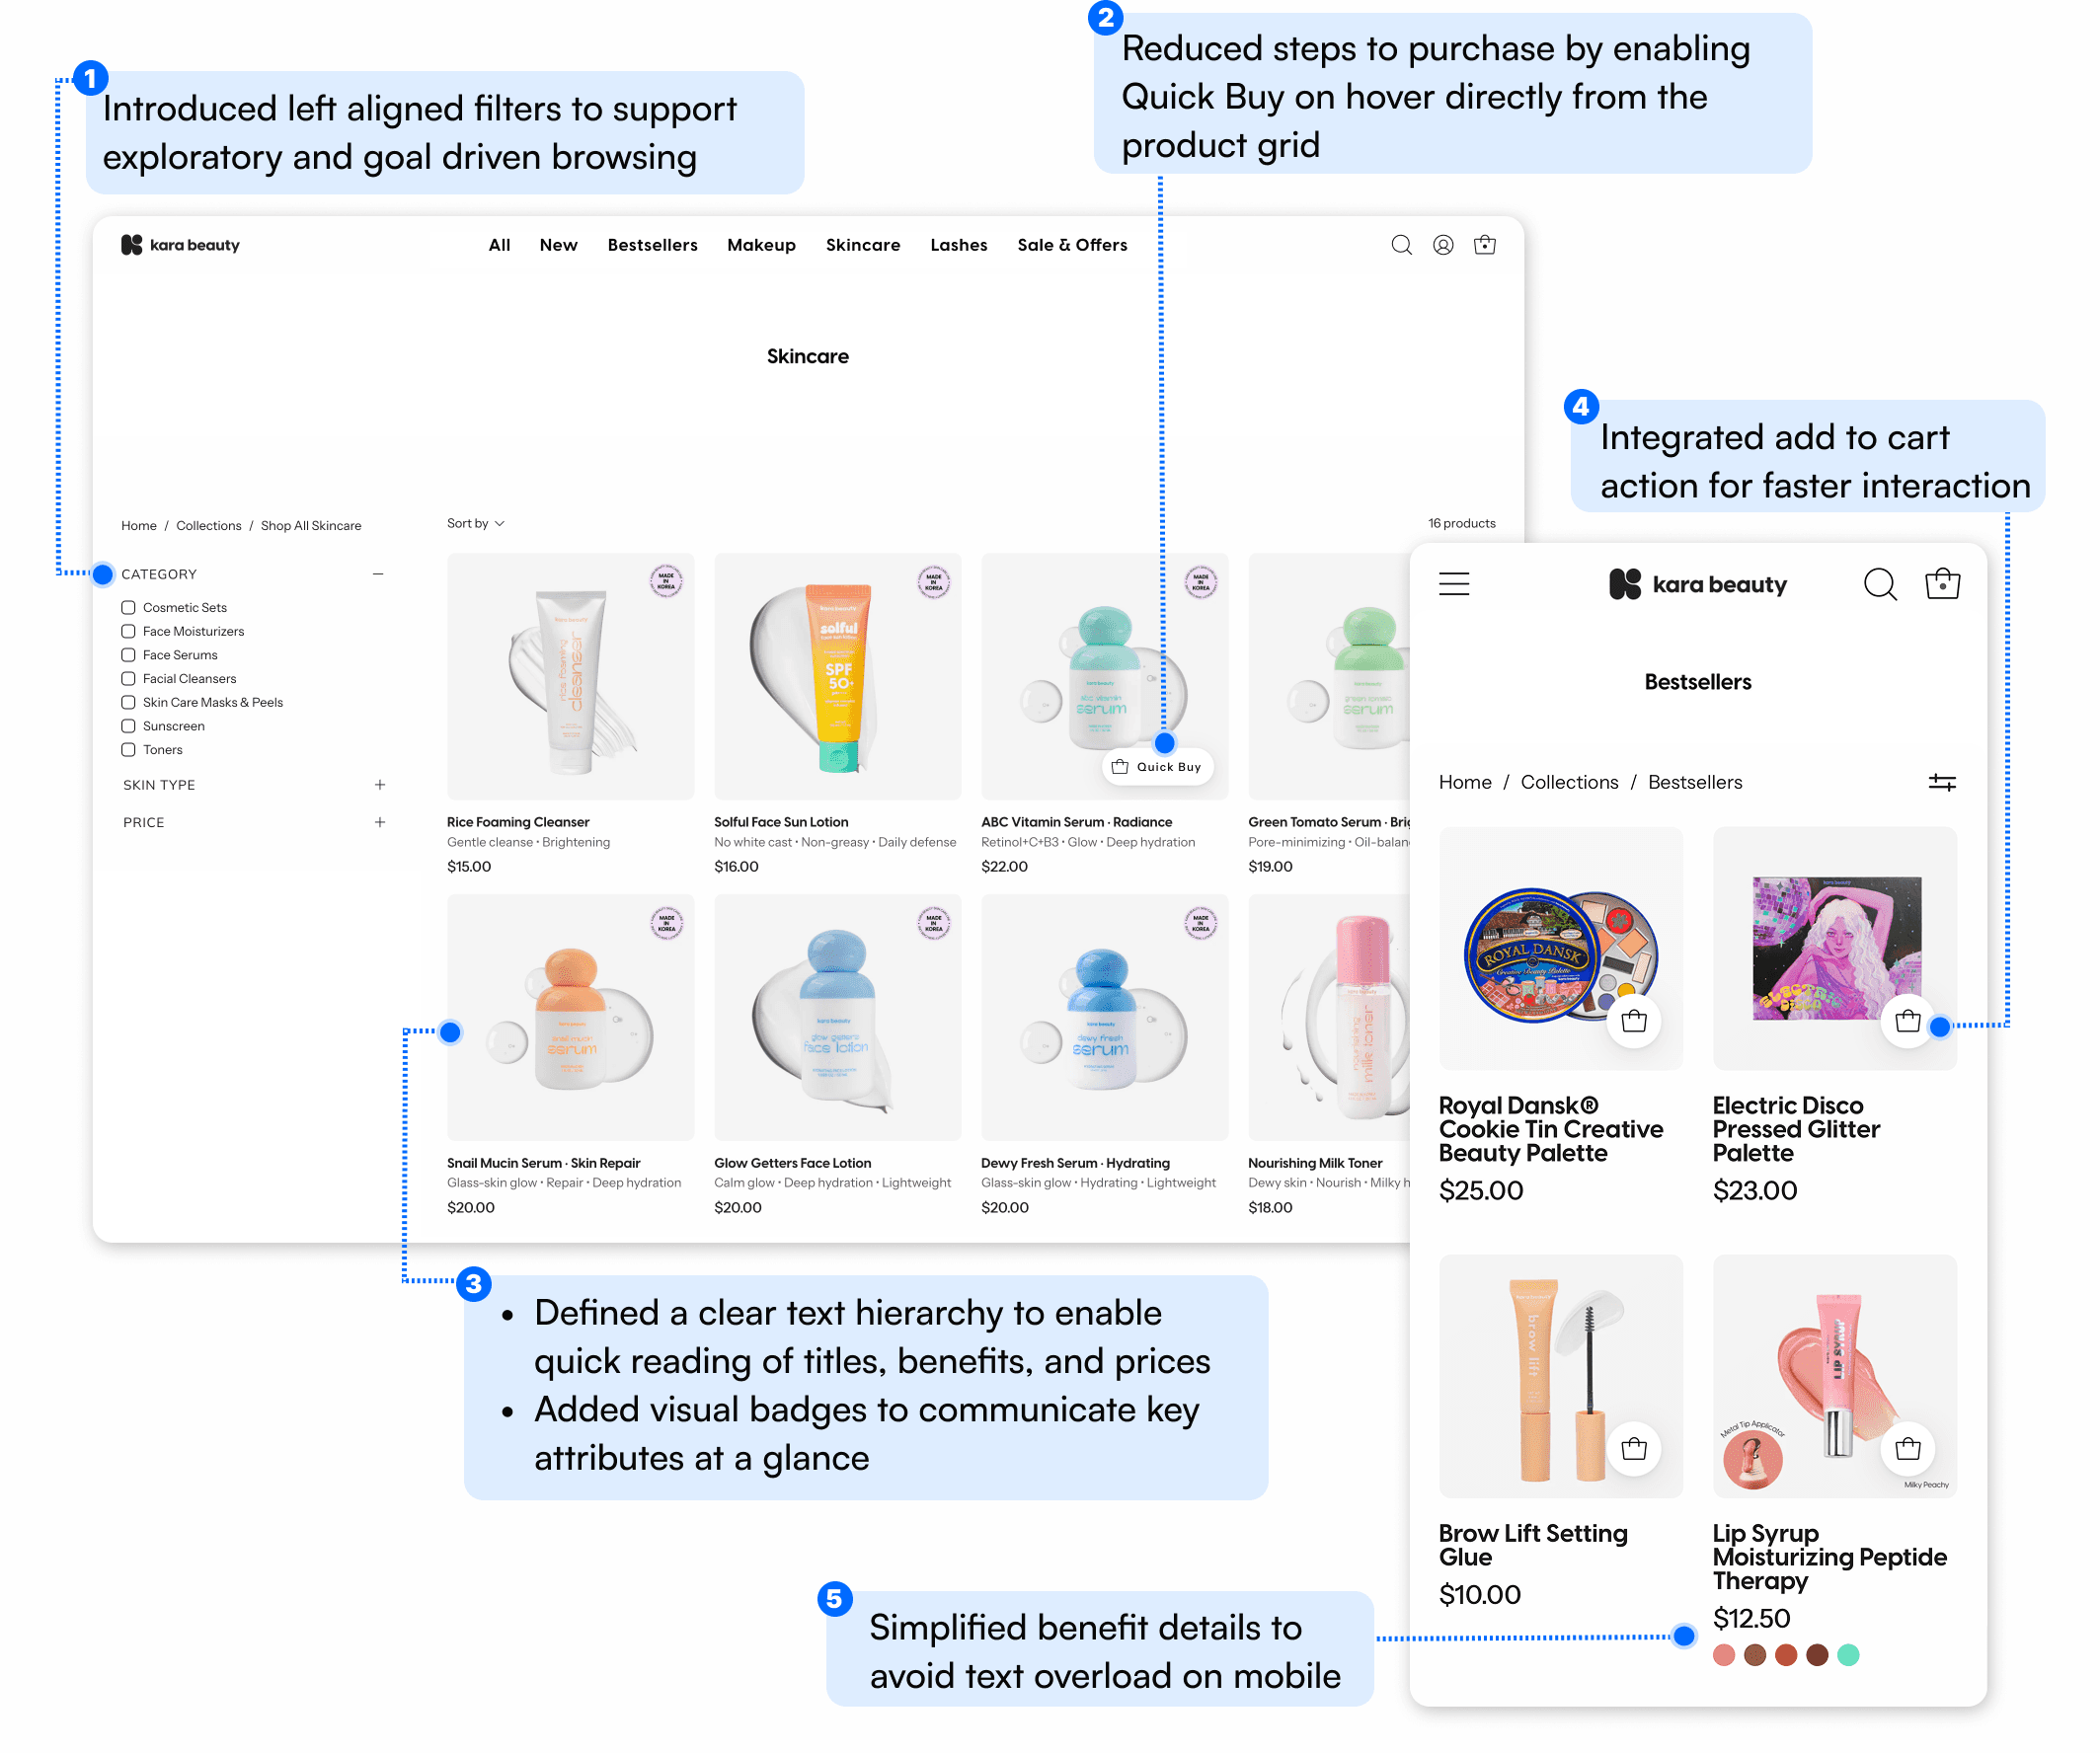
Evaluation - Product list page:
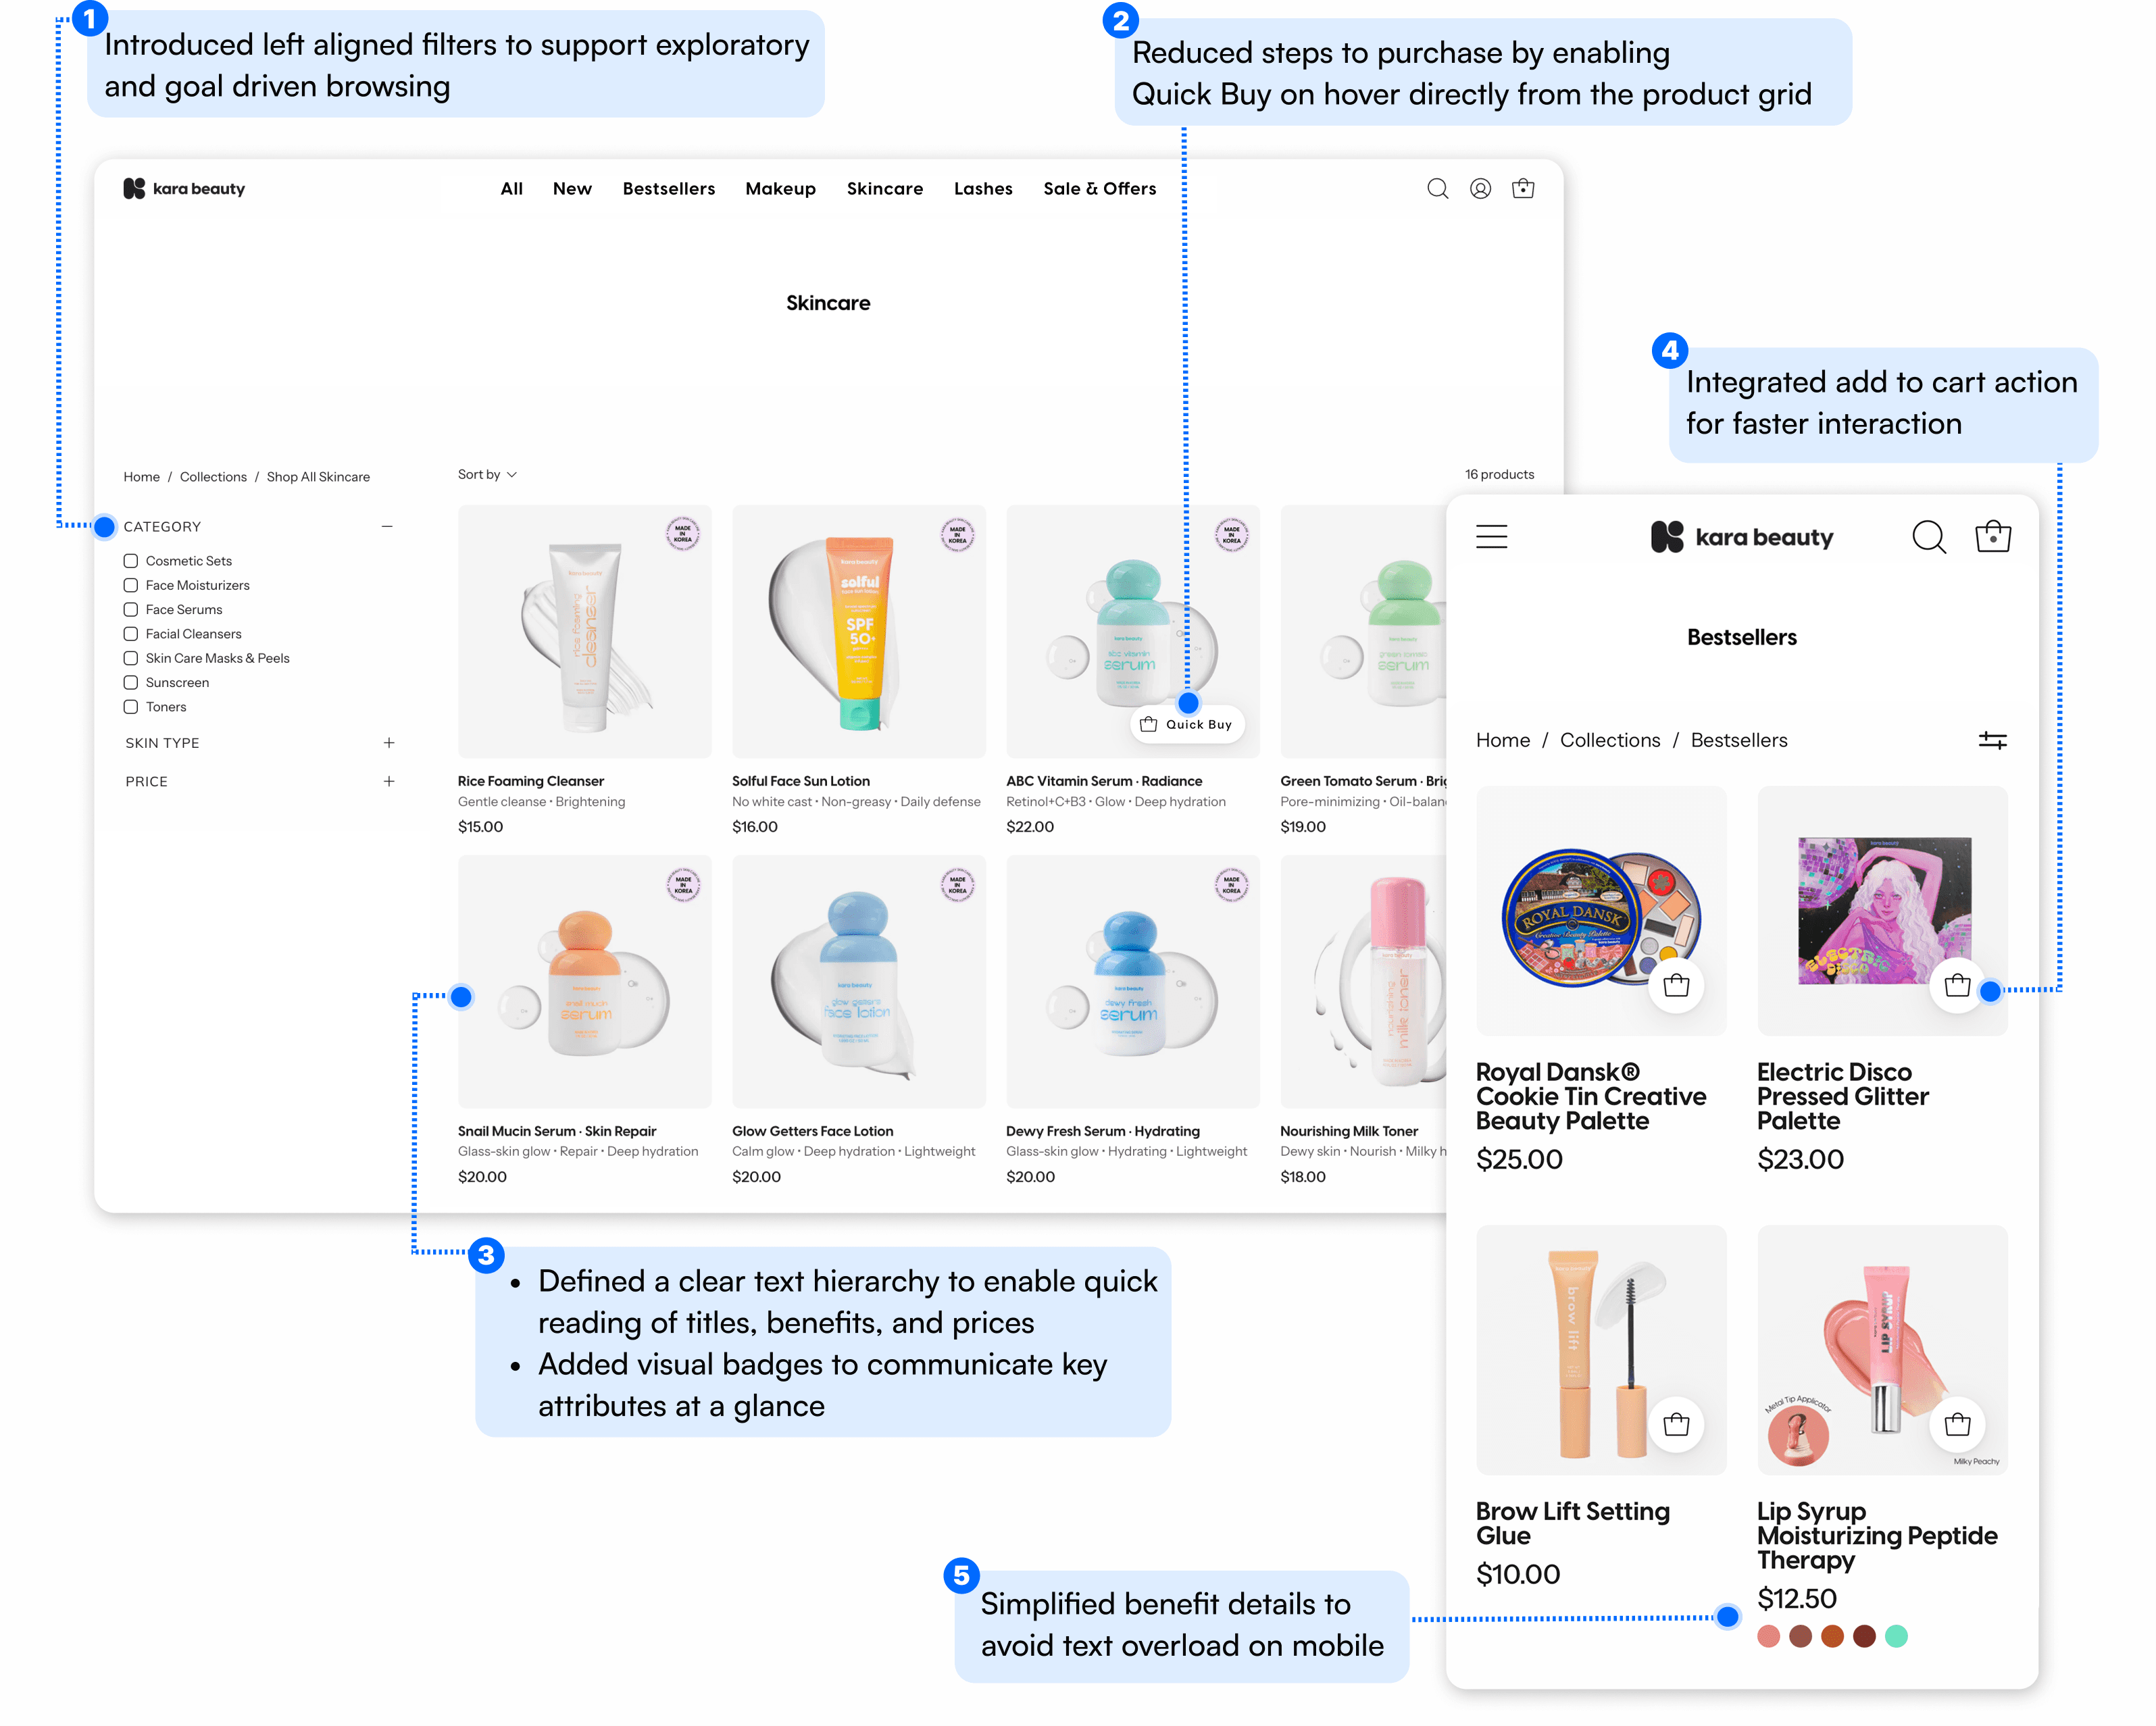
What this changes: Chips read as navigation rather than filters, there was no way to narrow the list, and cards showed only a name and price. Filters moved to a left rail, every card carries shade count, benefit, and price, and Quick Buy adds to cart from the grid. Participants compared faster and clicked around less.
Decision - Product detail page:
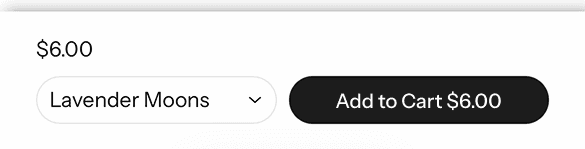
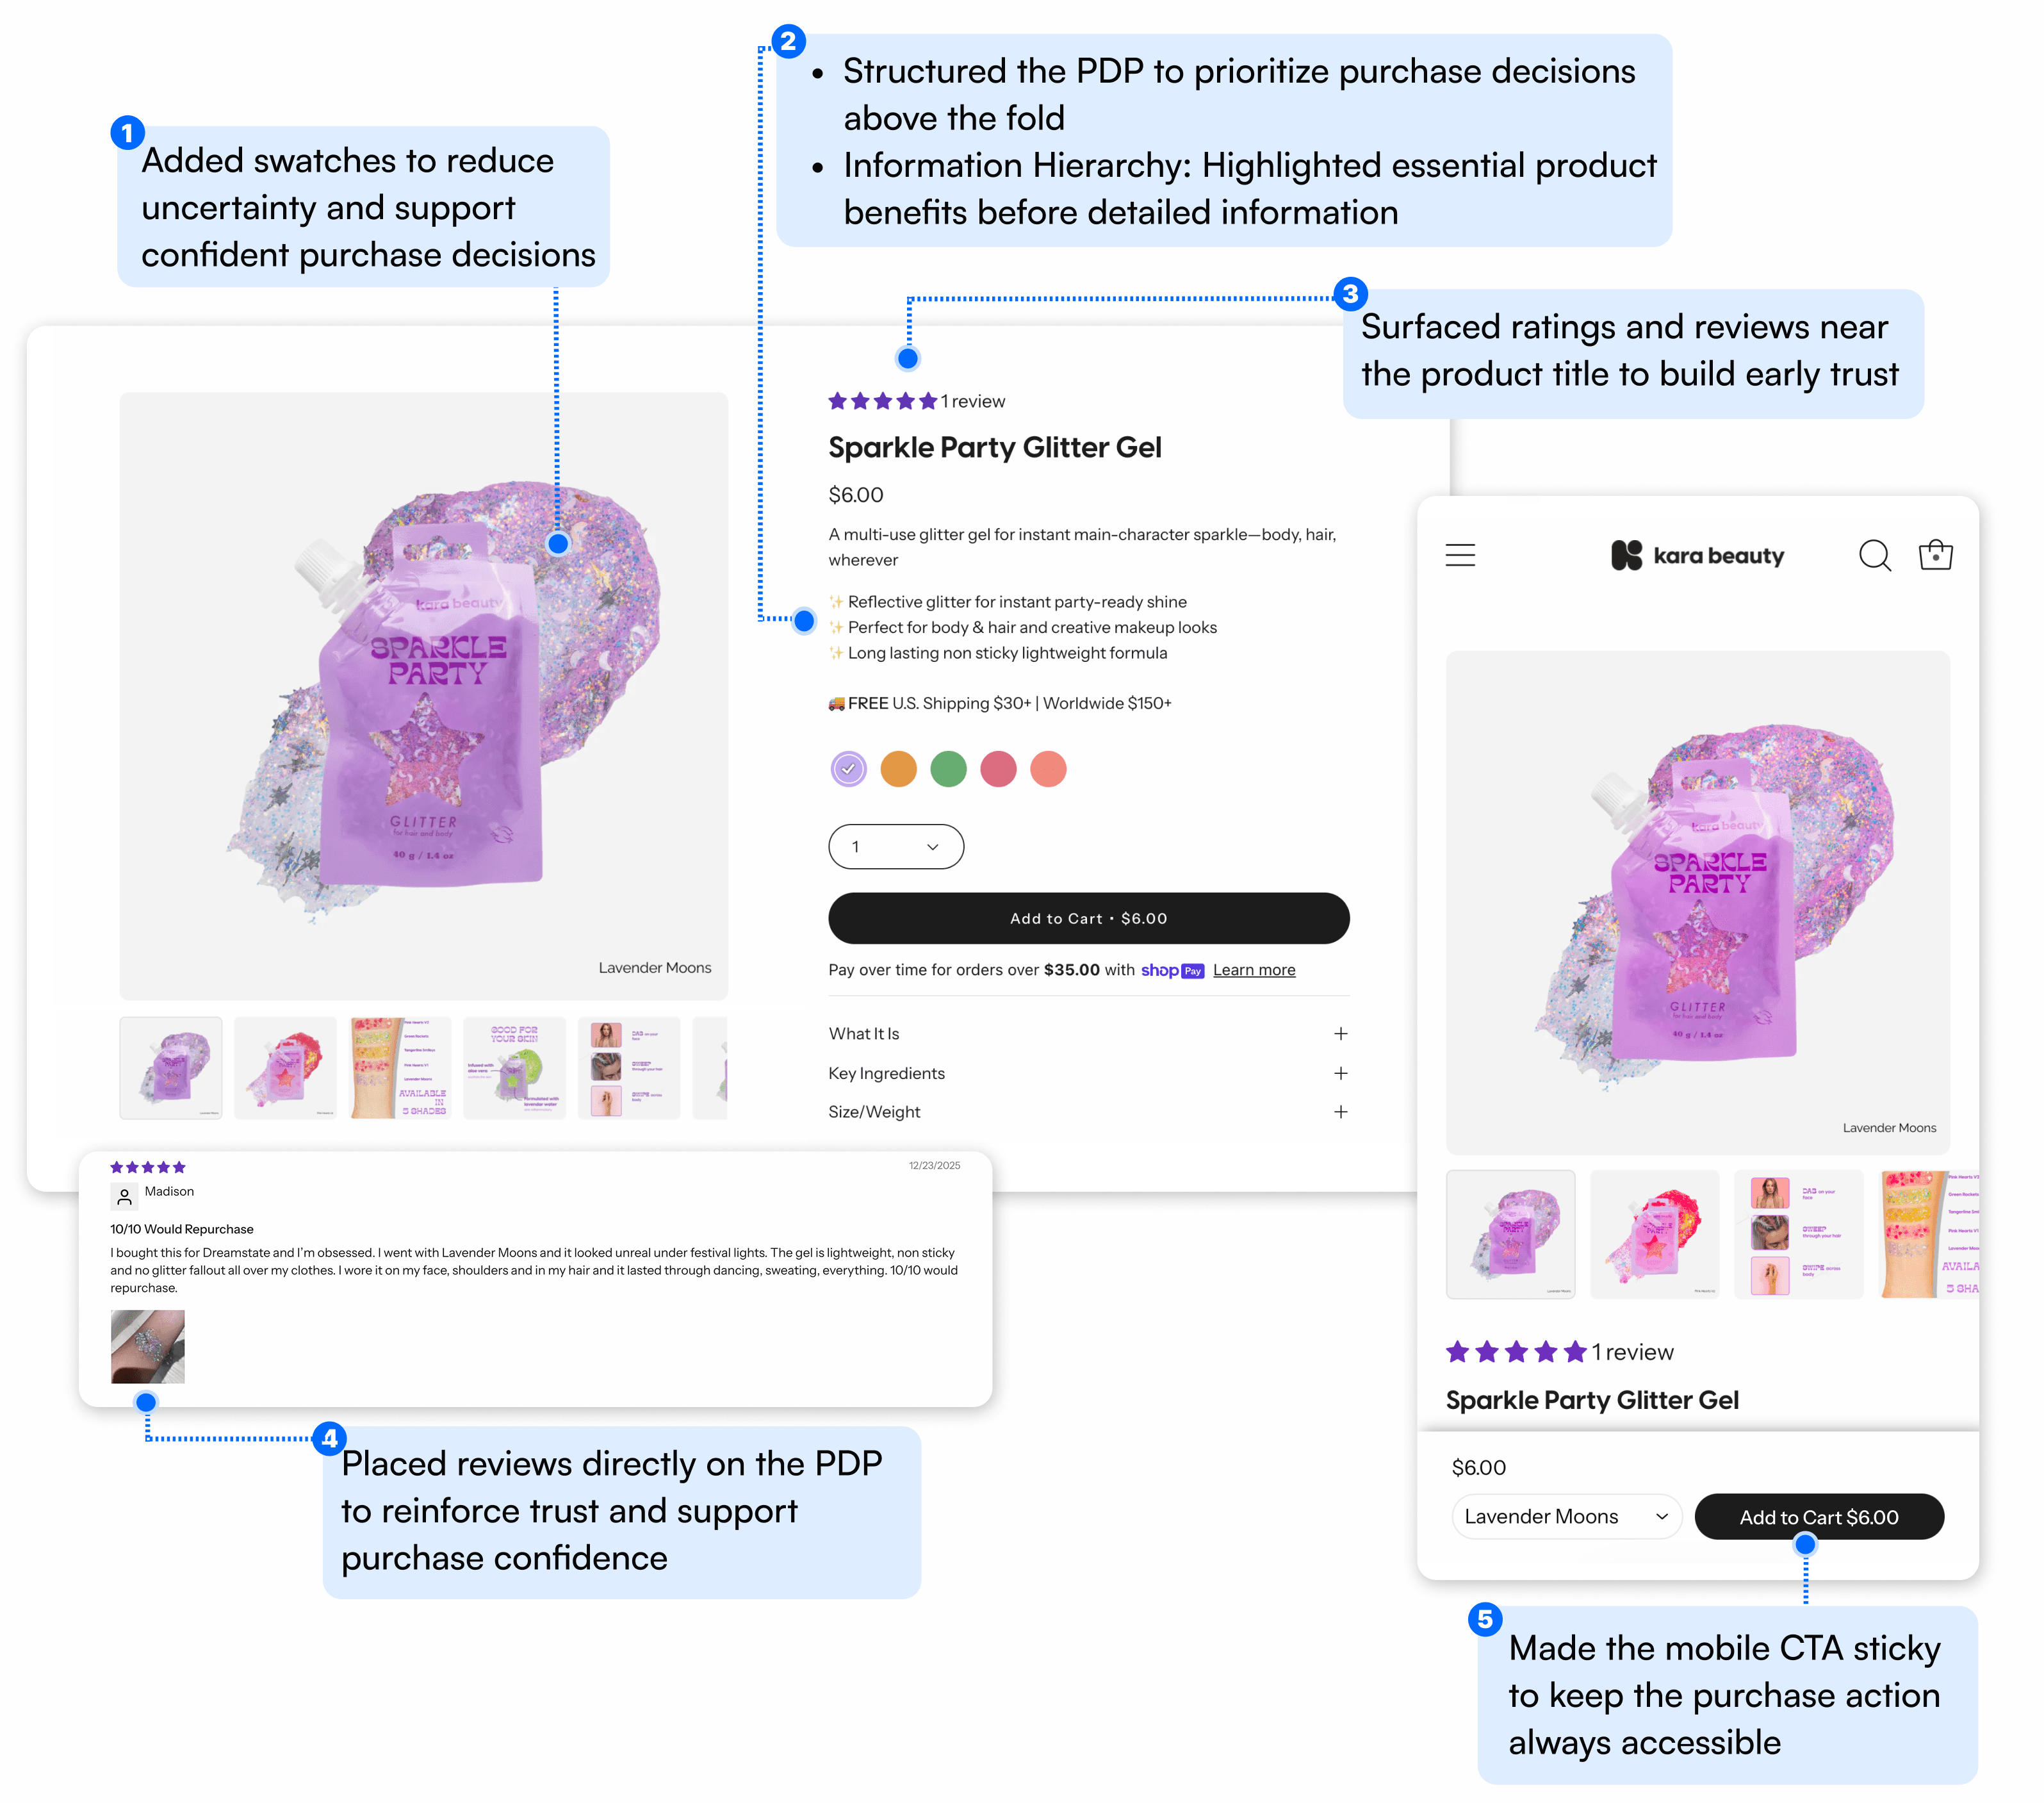
What this changes: Images showed packaging only, benefits sat inside a wall of copy, and the CTA scrolled out of view. Swatches, benefits, and ratings now sit above the fold, with the mobile CTA pinned. Participants noticed the primary action without guidance.
VALIDATION
Moderated comparison testing
4 Participants (3 Females, 1 Male)
Age: 20s - 30s
Task: Each walked the same task on both the original and the redesigned experience: starting from the homepage, find a makeup product worth buying and decide whether to add it to cart
What each moment validated
Discovery : Could shoppers tell where to start?
Participants identified an entry point faster on the redesign and backtracked less between home and the listing page.Evaluation: Could shoppers compare with less effort?
They explained product differences more quickly in the redesigned PLP and relied less on exploratory clicking.Decision: Could shoppers identify the primary action?
Key product information and the CTA were noticed without guidance, and participants described the redesigned PDP as more trustworthy.
The core issue was never missing content. It was the absence of guidance at these three points.
IMPACT
Where the impact came from
Discovery - Homepage
Categories replaced the "SHOP" label, cards gained a reason to click, and promotions moved out of the browsing sequence.Evaluation - Product list page
Filters became recognizable and usable, cards carried enough to compare without opening, and Quick Buy shortened the path to the cart.Decision - Product detail page
Swatches replaced packaging-only imagery, benefits and ratings moved above the fold, and the mobile CTA stayed in view.
Together these moved add-to-cart first. Conversion followed.
REFLECTION
What I learned
Conversion is a product problem, not a UI problem.
Improving hierarchy wasn't enough. What moved the number was how confidently shoppers could discover, evaluate, and decide.
Analytics showed where to look. Research explained why.
The funnel located the gap. Interviews and the flow walkthrough explained the friction behind it.Small details carried outsized weight at the decision moment.
Mobile CTA visibility, review placement, and immediate access to shades and benefits mattered more than their size suggested.
What's next
Diagnose the checkout gap I scoped around.
Checkout ran on the platform's native flow, so I scoped this project upstream. That was right, but I treated "I can't change the checkout screen" as the end of the question. Completion sat near 3% against an industry norm well above 40%, and a gap that large usually points to traffic quality or measurement rather than layout. That's the first thing I'd pull apart, even though the fix wouldn't be mine to ship.Check whether the gains hold.
Repeat purchase rate, return rate, and review sentiment would show whether a better decision experience produces better orders, not just more of them.
10. VISUAL DELIVERABLES
Scroll over the image to view the full image

Scroll over the image to view the full image